Read about the new features and improvements added to the Stratsys platform over the past month and how they can help you improve your work and get even more value out of it.
Platform News
New Workspace and Object drawer
These features are included in the product license.
Here, we’ll share the major updates and improvements that are continuously being added to the workspace and object drawer. These features are available in all products. Contact your account manager to get started!
Easier planning and collaboration with 'draft'
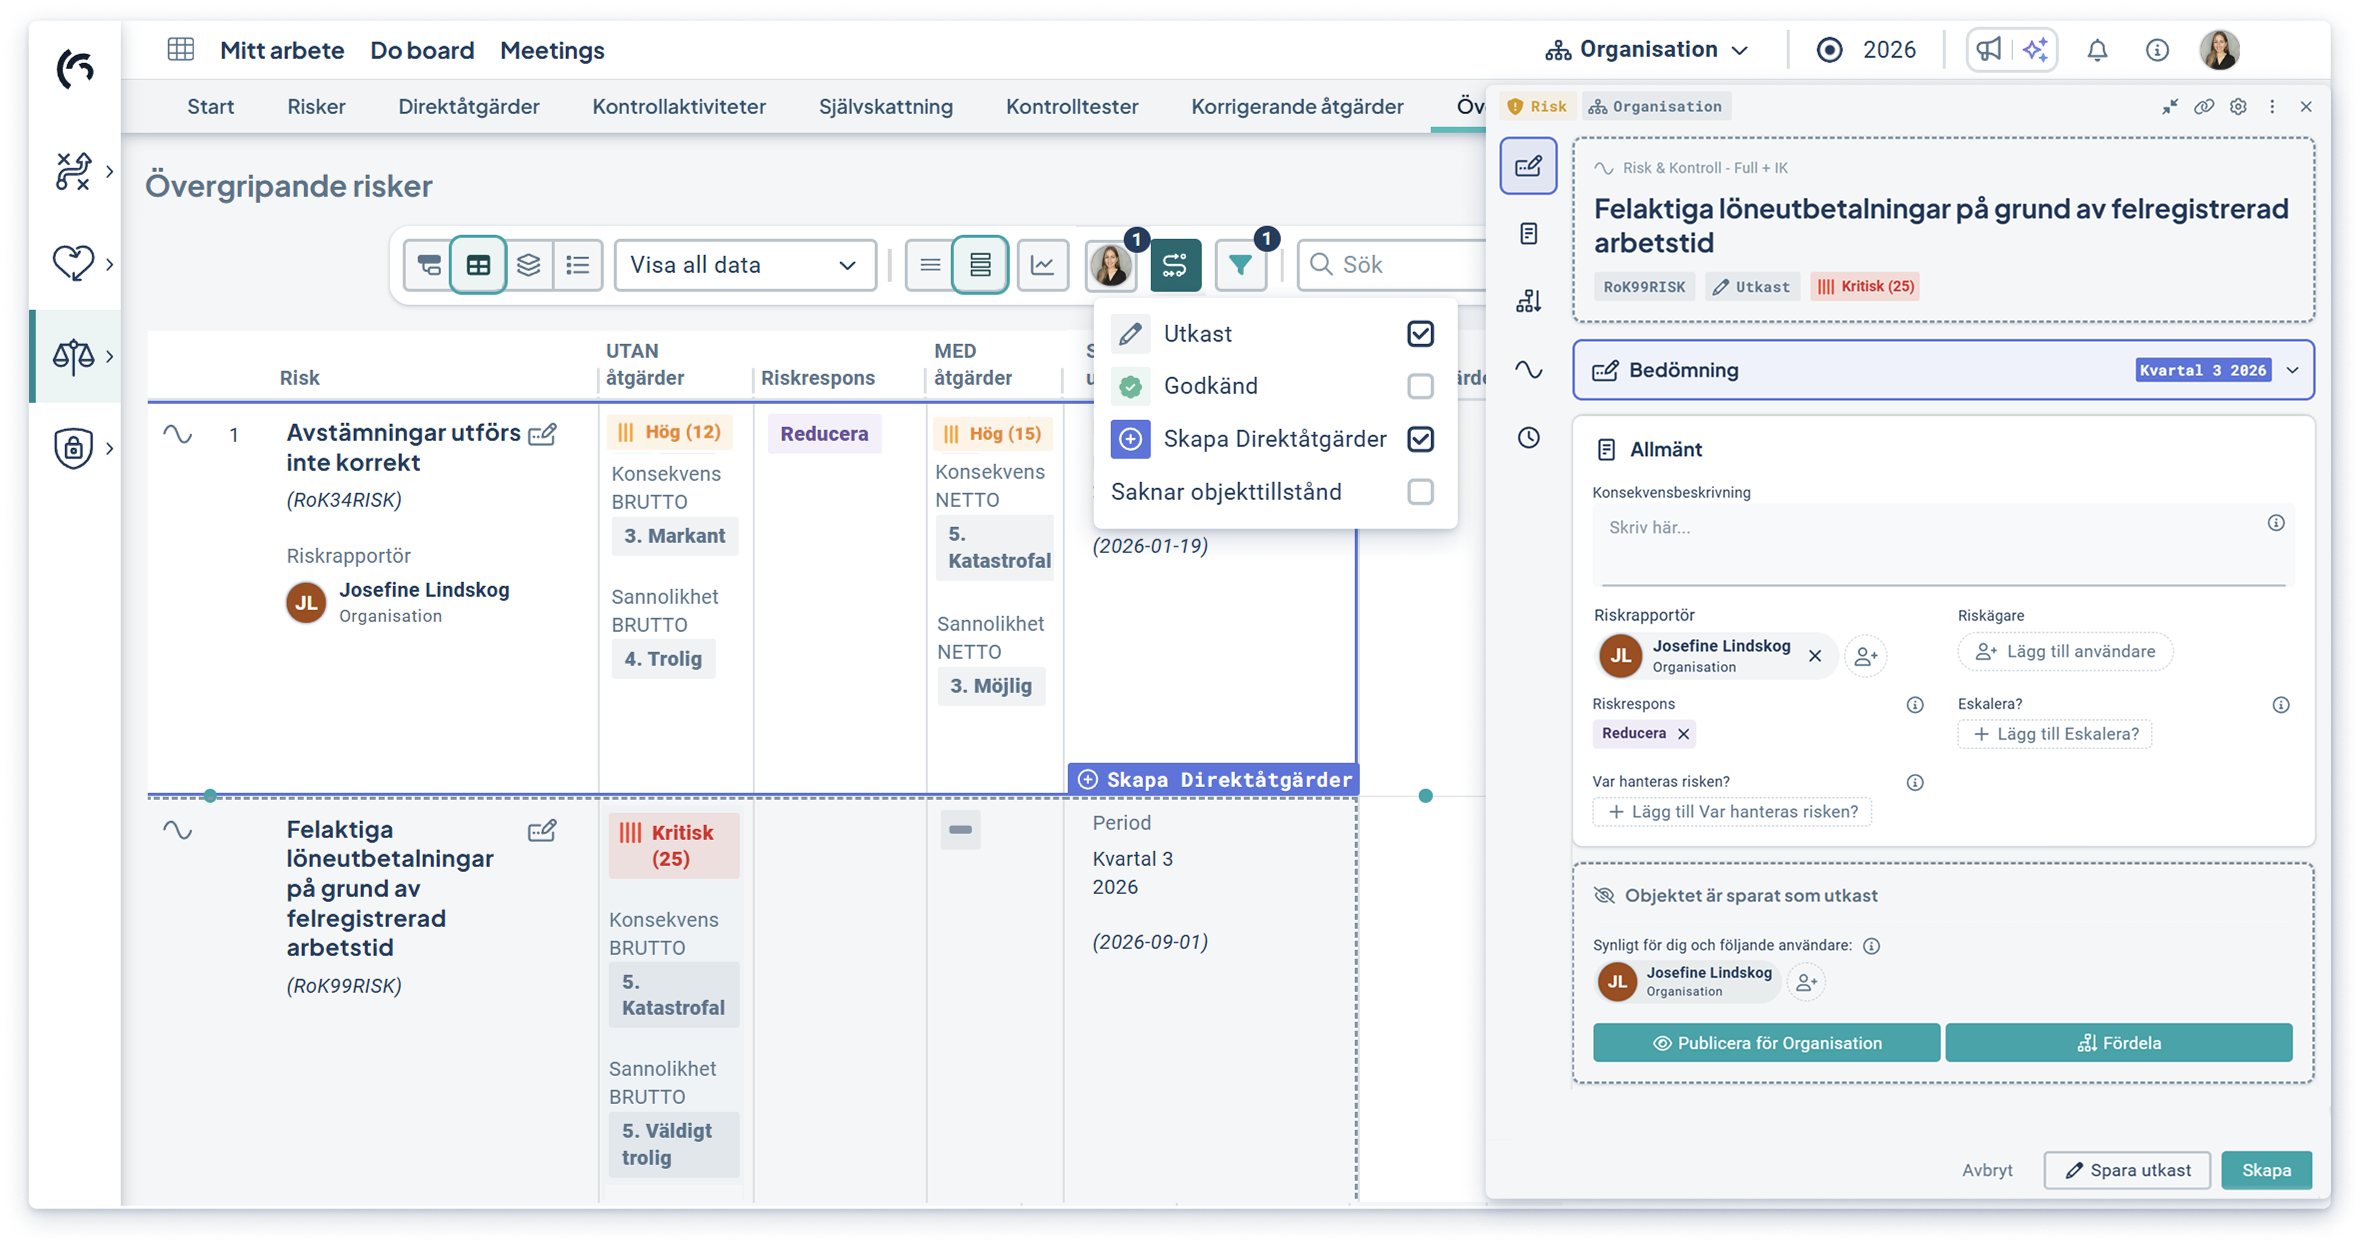
In June, we released the first part of the all-new 'Dynamic workflows' feature set, focusing on enhanced risk management. Now we’re launching the next part—the ability to save objects as drafts.
By saving objects as drafts, you as a user can collaborate more extensively with selected individuals and decide when, for example, a risk or activity is ready to be shared with the rest of the organization. This results in a clearer workflow, lowers the barrier for entering data into the platform’s various products, and simultaneously strengthens collaboration opportunities.
- Clearer Workflow and Lower Barrier to Entry—Save ideas or information that hasn’t yet been finalized as drafts.
- Increased collaboration—Share your draft with selected colleagues and finalize the item together.
- Efficient search—Easily filter all your drafts to edit them or convert them into active items.
Activation: This feature is automatically available to all users with permission to create and edit objects and requires no activation.
Workspace—edit directly in table mode
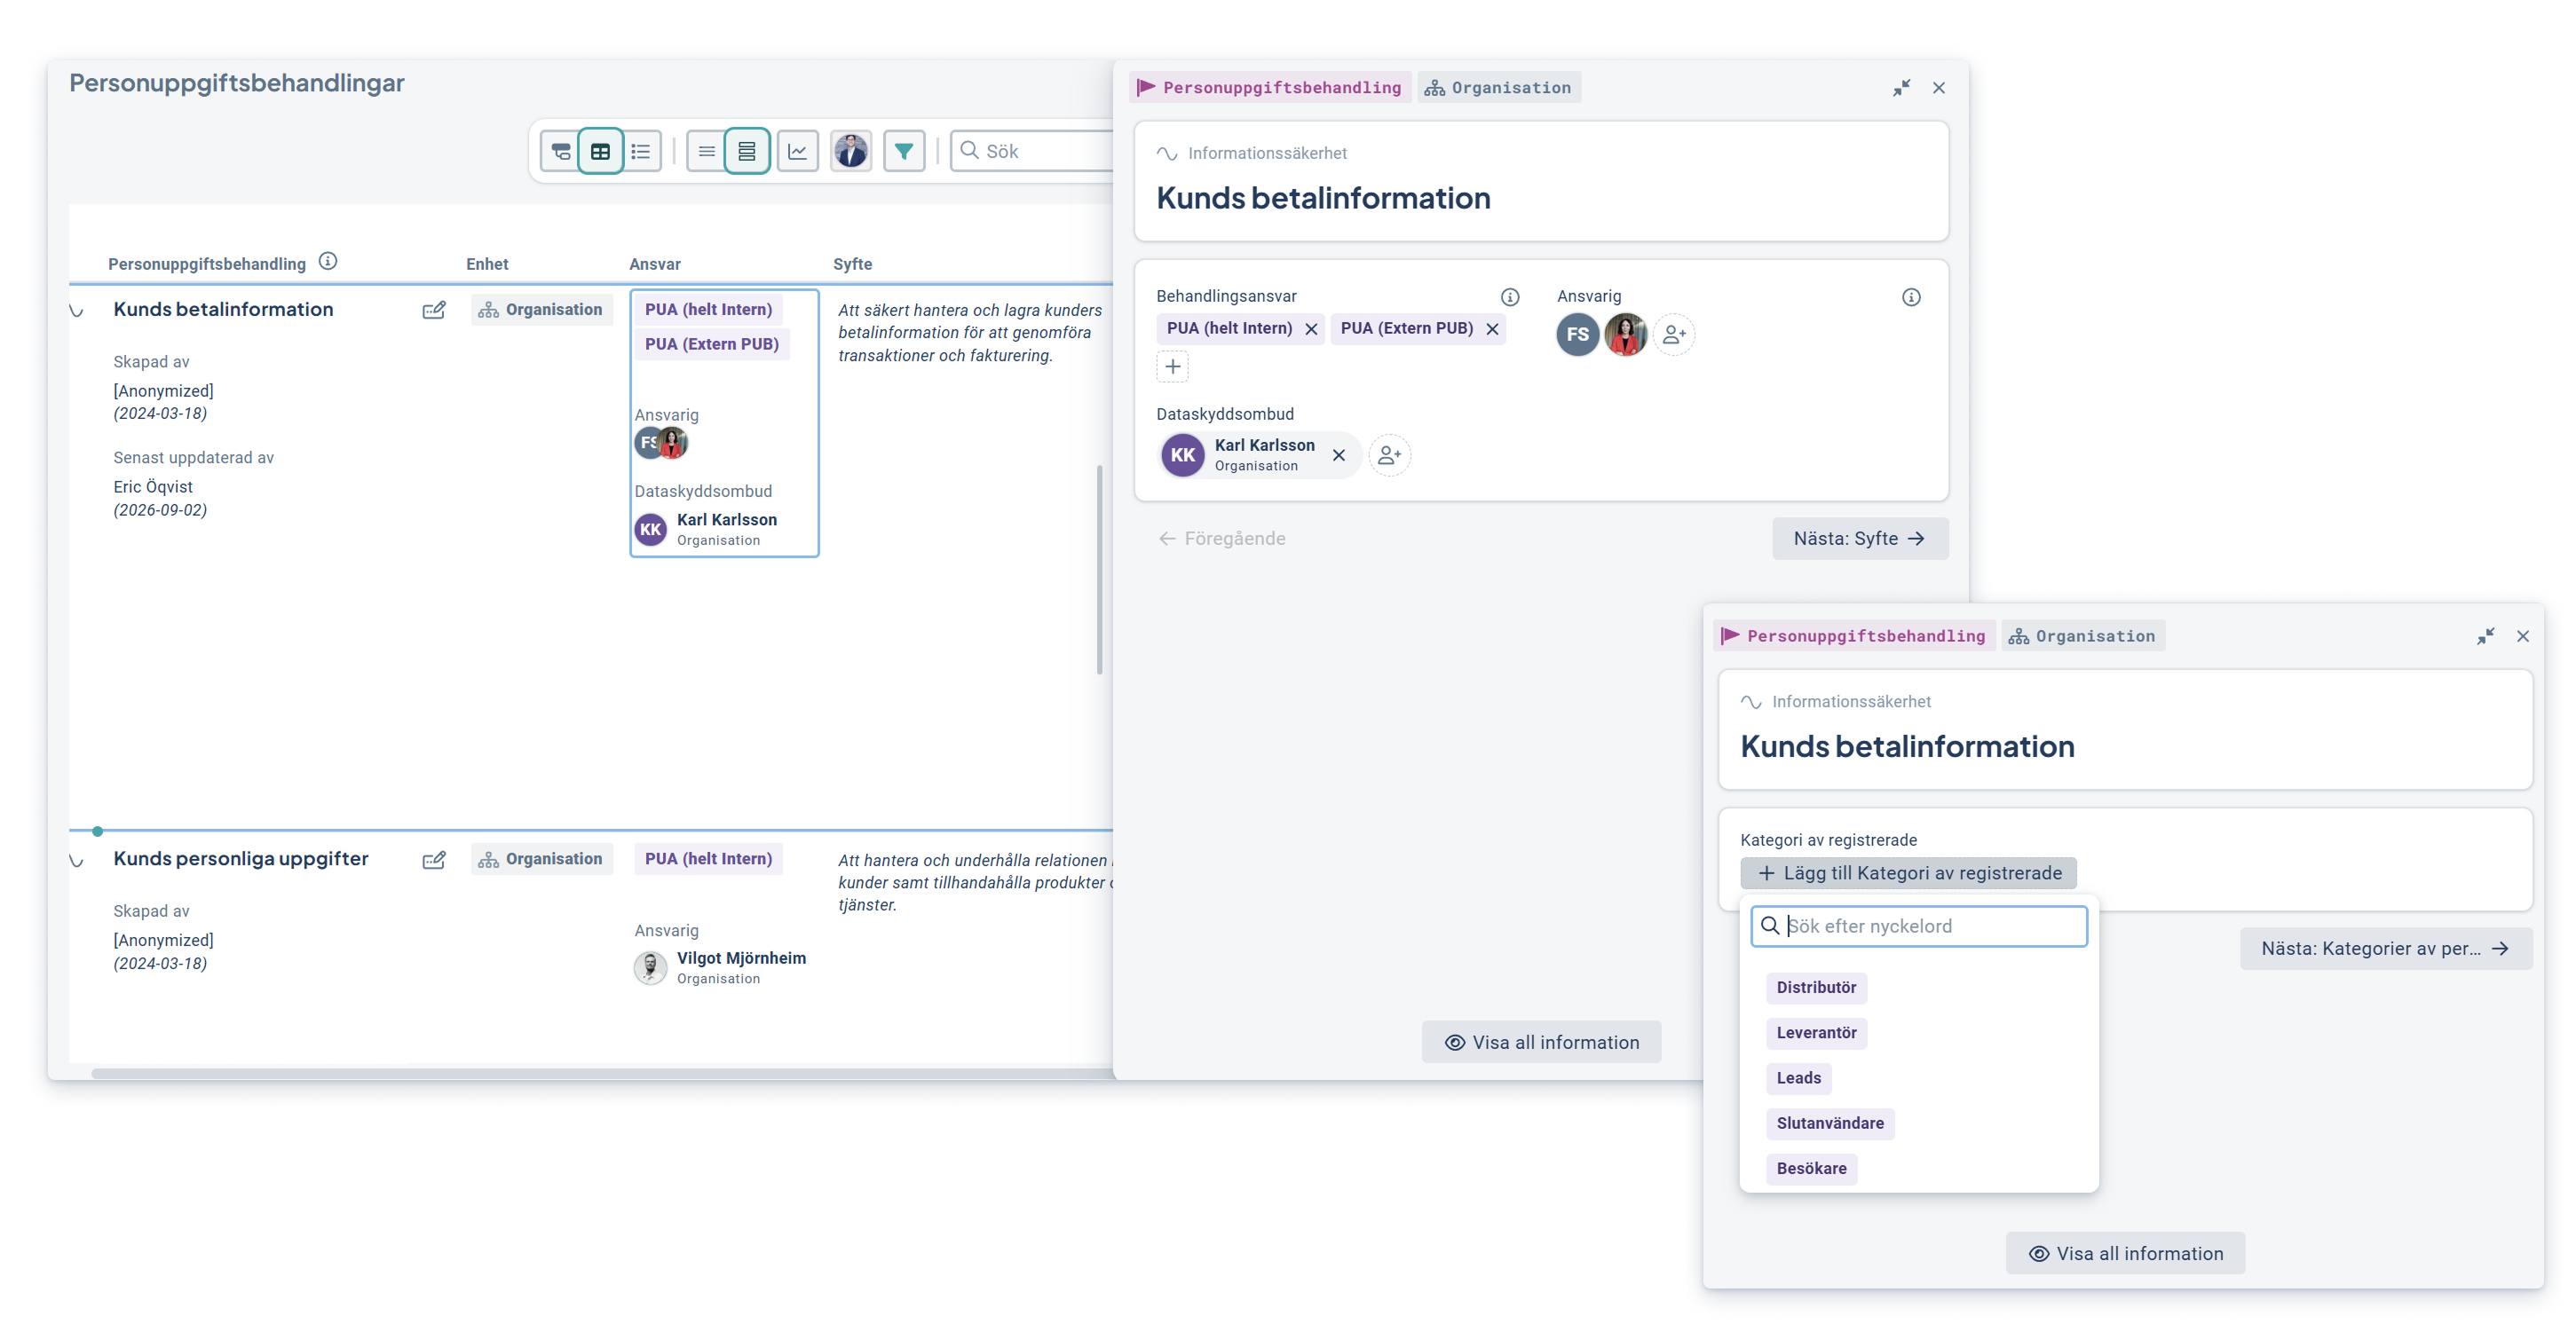
It’s now easier and faster to document and update information in the workspace. With the new editing mode, you can edit information directly in the workspace’s table mode without first opening the entire object drawer.
Editable fields are clearly marked, and you can also see where information is missing. Click on a field to make your change, then move on to the next field. This feature can be used for risk assessments, classifications, dimensional data, descriptions, and keywords, among other things.
-
Update information faster directly from the workspace.
-
Clearly see which fields are editable and where information is missing.
-
Move seamlessly from field to field as you document multiple pieces of information.
Activation: This feature is enabled by a full administrator in the workspace’s view mode administration. The feature is available for those columns in the workspace where editing is permitted. Which columns can be edited is configured via the column settings in view administration.
Risks - Track development with continuous assessments
Risks do not always change in line with the organization’s regular reporting periods, and it can be difficult to track and maintain an overview of devthe risk delopment over time. To better support the documentation of risks as soon as the risk landscape changes, we’ve introduced the ability to assess risks on an ongoing basis and more frequently.
With the ongoing reporting feature, you can perform a new risk assessment as soon as the risk landscape changes, and each assessment is saved with the date.
Since previous assessments are retained, this feature also enhances the ability to track the development of individual risks over time in a more visual and streamlined manner.
- Enables risk assessments to be conducted immediately when the risk landscape changes, even between regular reporting periods.
- Track the evolution of risks over time to gain a clearer overview of the impact of implemented measures.
- Keep the information for the current reporting period up to date as new assessments are recorded.
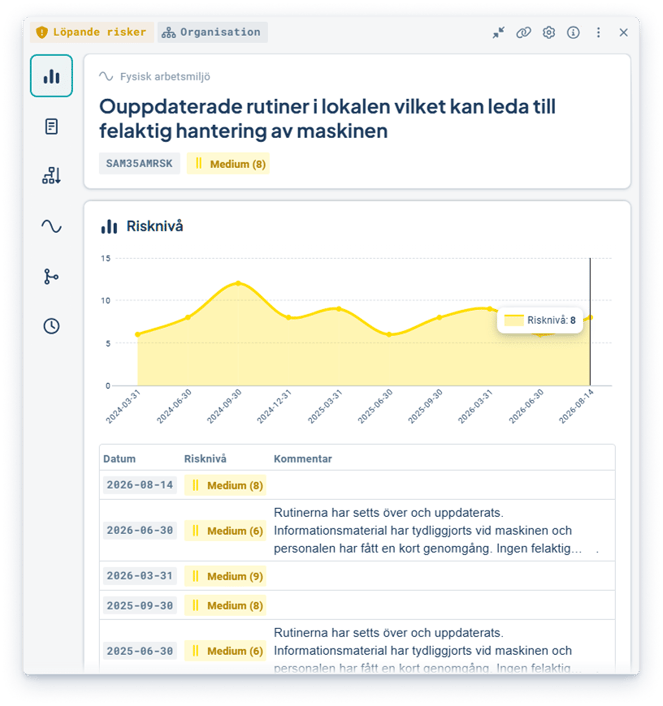
In this first version, the feature is only available via the object drawer's quick follow-up and is intended for those of you who work with only one risk assessment or matrix.
Activation: The feature is currently being activated by Stratsys and is available to customers with a product license. Contact your Stratsys representative for activation, information about product licenses, and guidance on how to prepare your risk management process for continuous risk assessment.
Measurement relations —More Stable Data Aggregation and Transfer
We have improved the handling of measurement relationships to ensure more stable aggregation and transfer of data between metrics. A metric now uses measurement relations in one primary scorecard model at a time. This reduces the risk of calculations being affected when the same KPI or classification is linked to multiple control models and products.
In the metric settings for a specific KPI, you can see which scorecard model is primary and which other scorecard models use metric relationships. If the metric is linked to or moved to another scorecard model, you can change which scorecard model should be primary.
- More stable aggregation and transfer of data between metrics.
- Clear overview of which model is used for the measurement relations.
- Ability to change the primary model when metrics are moved between models.
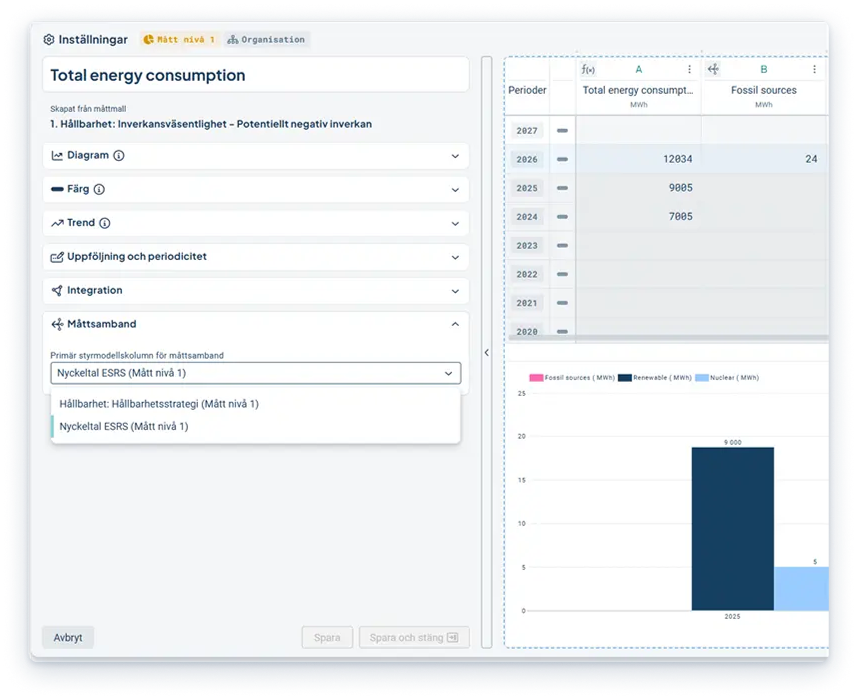
Activation: This feature is automatically available for all metrics that have formulas for measurement relations and requires no activation.
Workspace—Overview Mode by Default
It is now possible to select overview mode as the default for workspace view modes, where users will always land in that view mode at the start of each new user session. This means that all view modes are now available to choose from.
This allows for better customization of the workspace to suit users’ intended workflows and provides easy access to and immediate focus on relevant content.
- Reduces the need for manual navigation when users open a workspace.
- Makes it easier to customize workspaces based on process.
- Provides a more efficient starting point for users working with, for example, risks, KPI's, or activities.
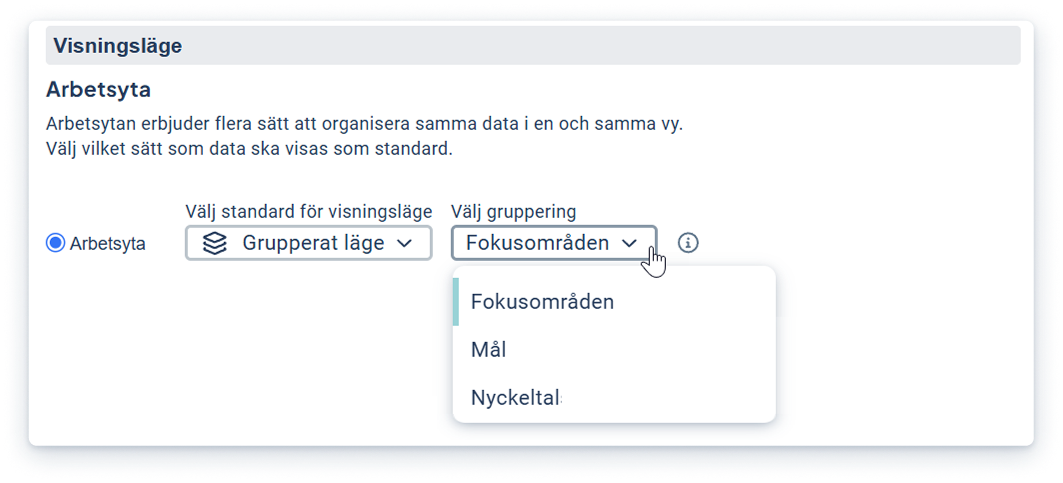
Activation: The default overview mode is configured by a full administrator. This is done by selecting the overview mode and, if applicable, the grouping that users should be directed to first.
The Workspace—Visualization of Emission Factors
It is now easier to view emission factor data directly in the workspace. Previously, there was only a visual indicator of that emission factors were associated with the current metric. Now you can view the information in context to more easily understand and verify values, without having to leave the workspace.
- Quickly see which emission factor is being used for a value—both local and global.
- Verify sustainability data directly in the workspace.
- Gain a better understanding when different emission factors are used for different data points or periods.
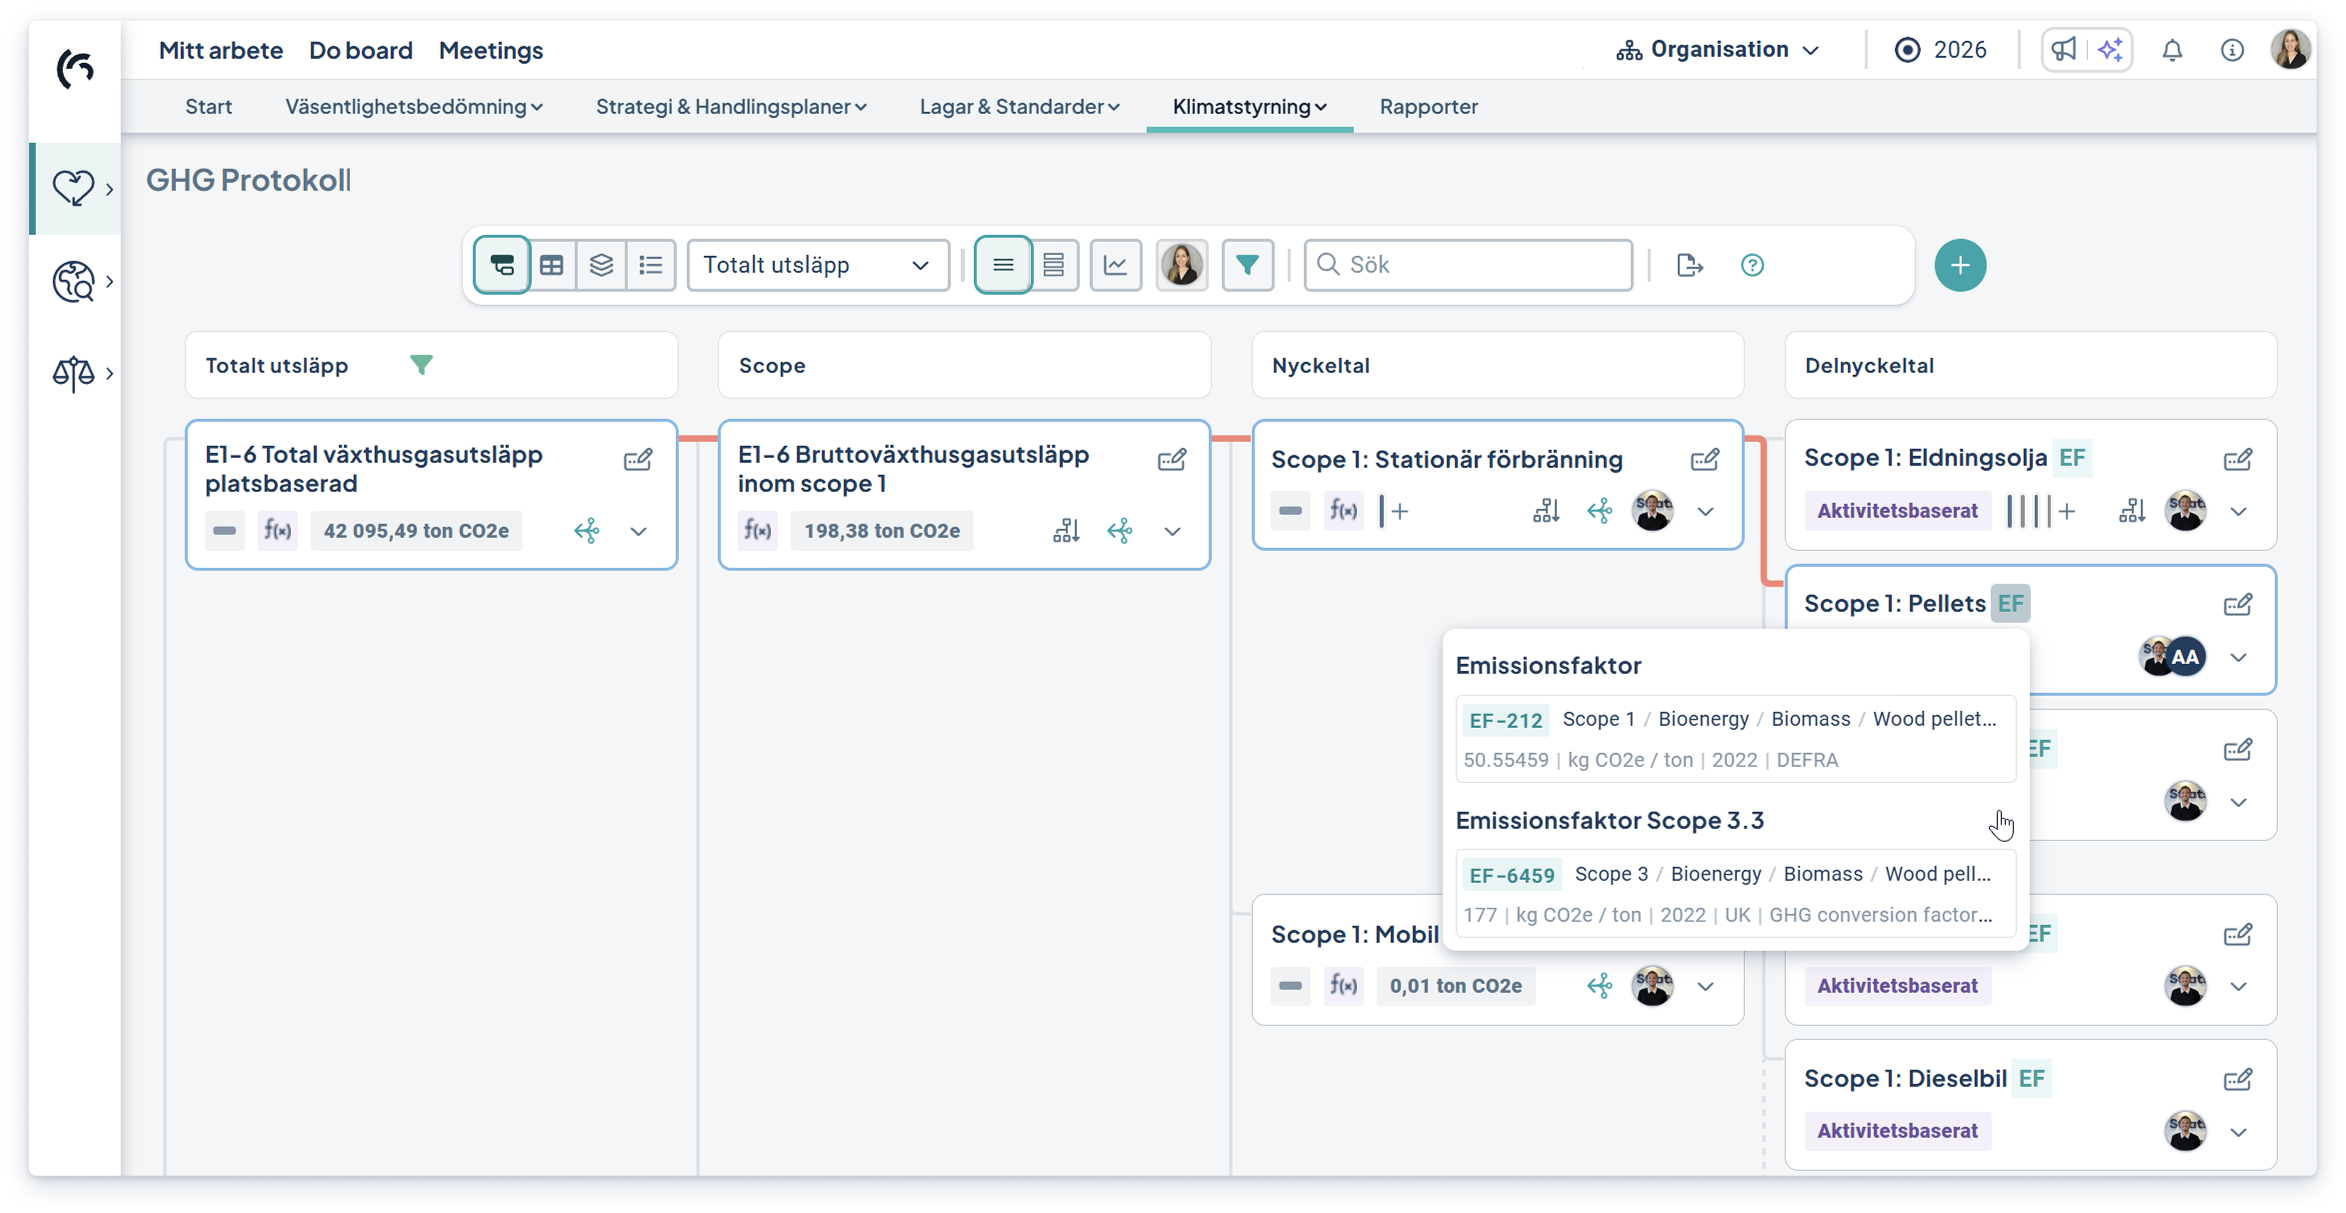
Activation: This feature is automatically available when the underlying measurement data includes emission factors and requires no activation.
Workspace—Improvements to List mode
We’ve made a minor improvement to the drill-down table in List Mode, where it’s now possible to view comment data. This further enhances the overview by providing access to more tracking details and makes the workspace more consistent. We've also revised the table header to make the presentation of, for example, postfixes more readable and consistent with the object drawer's measurement settings.
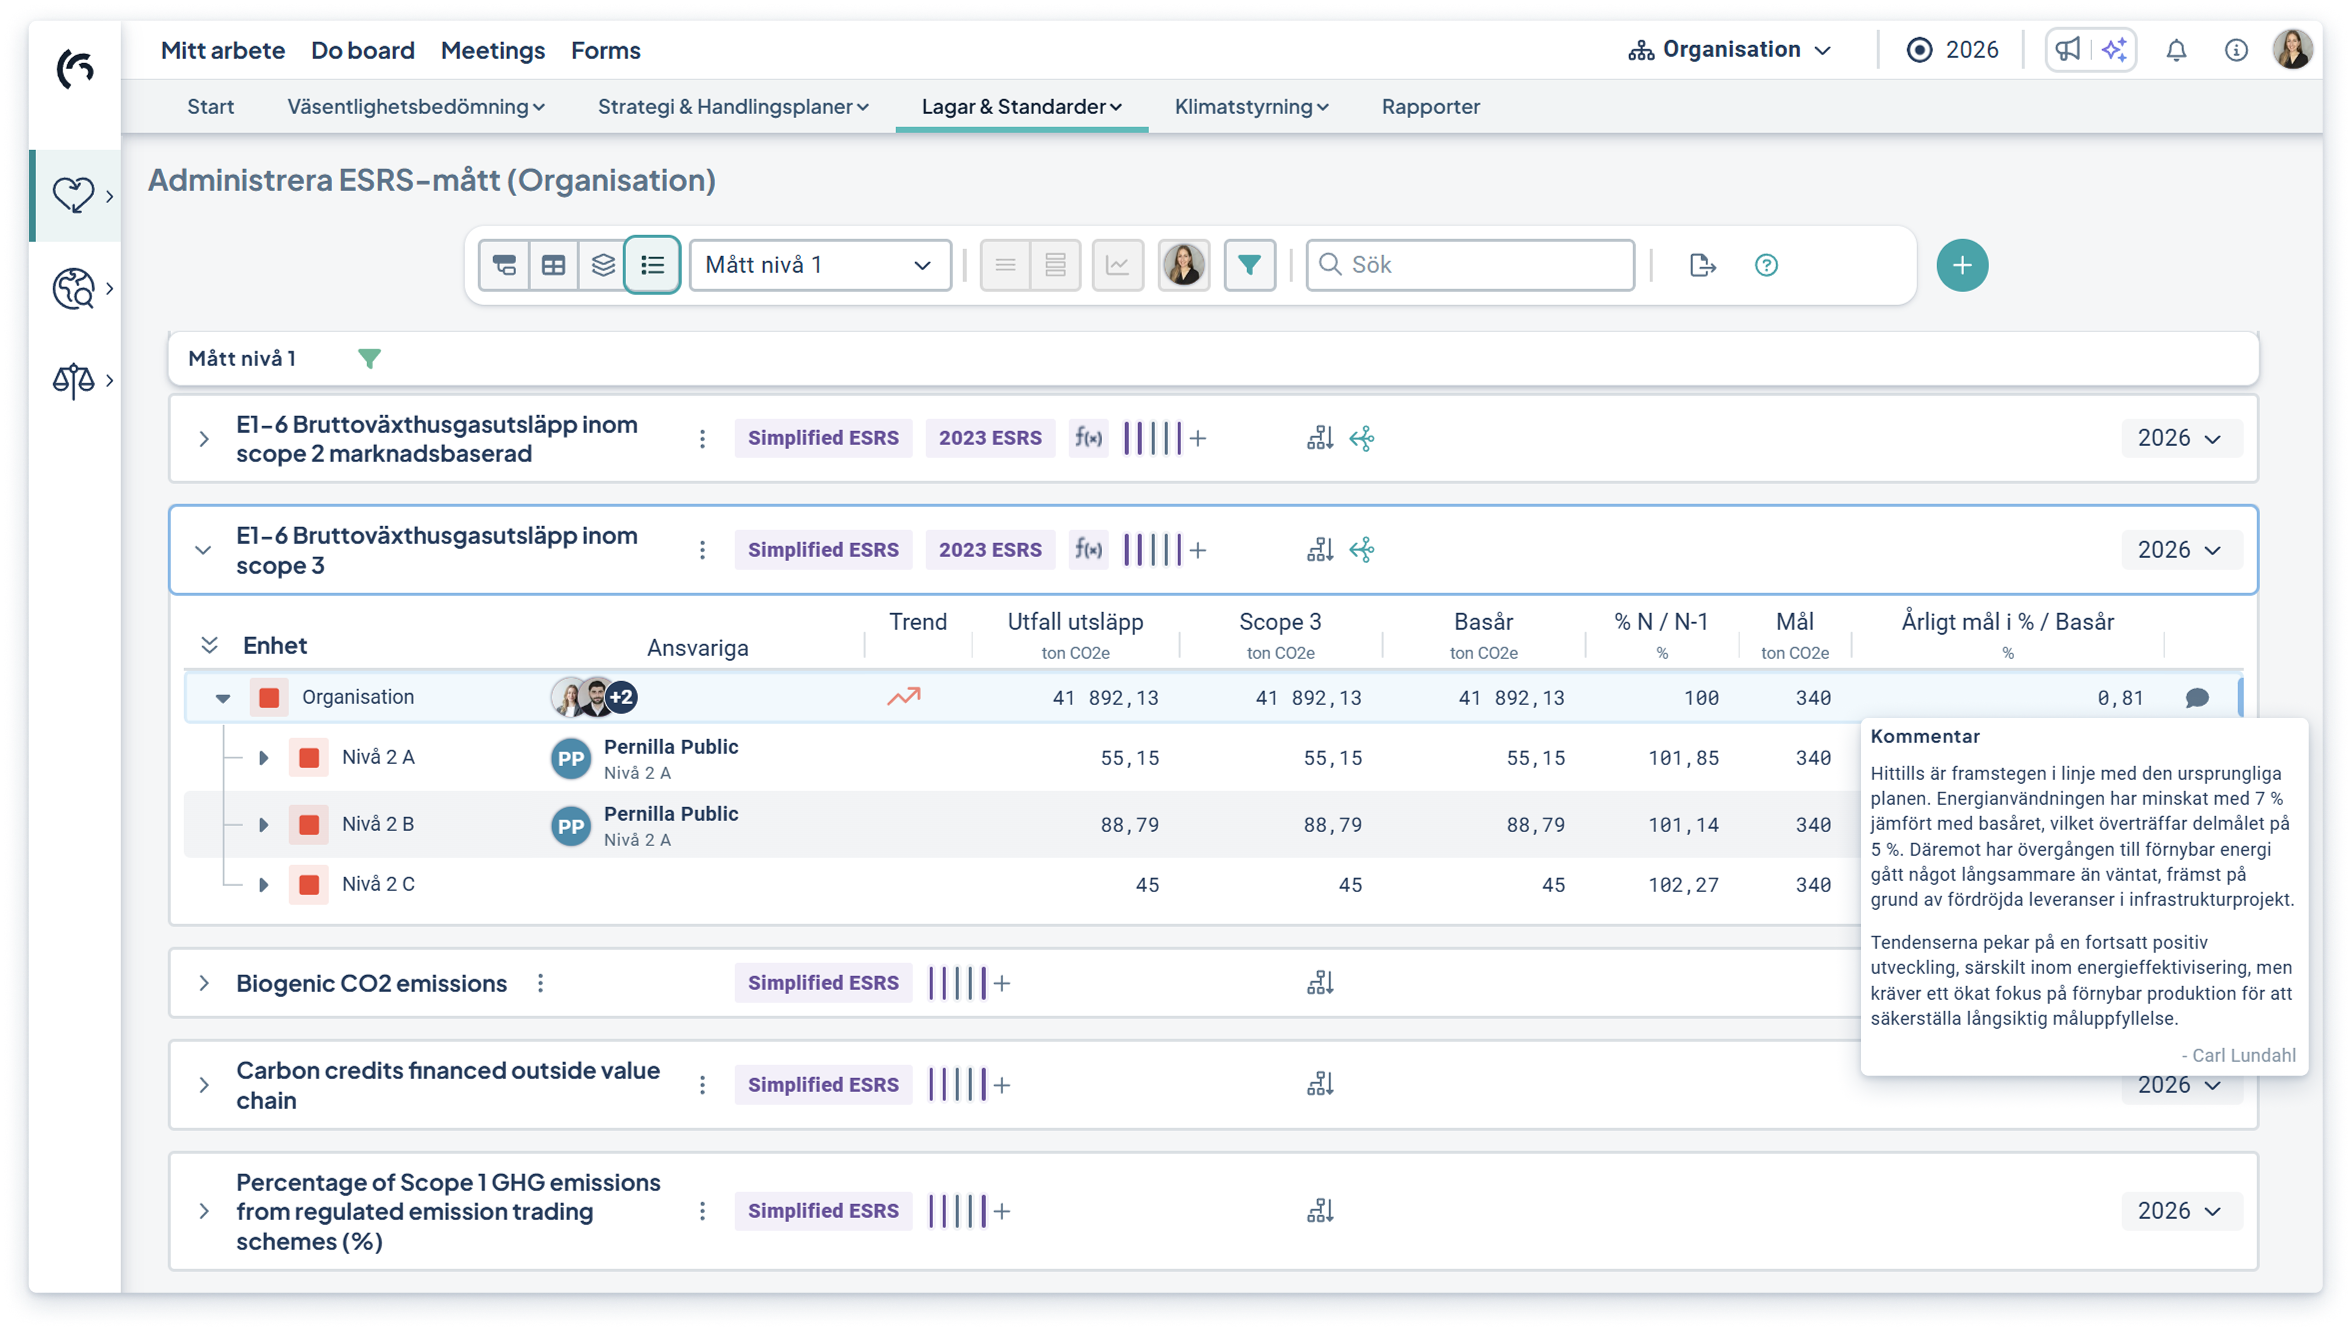 Activation: The improvements are automatically available and requires no activation. If a comment has been saved for the selected object and period, the comment button for each department is automatically displayed.
Object drawer —Clearer Information and History for Attachments
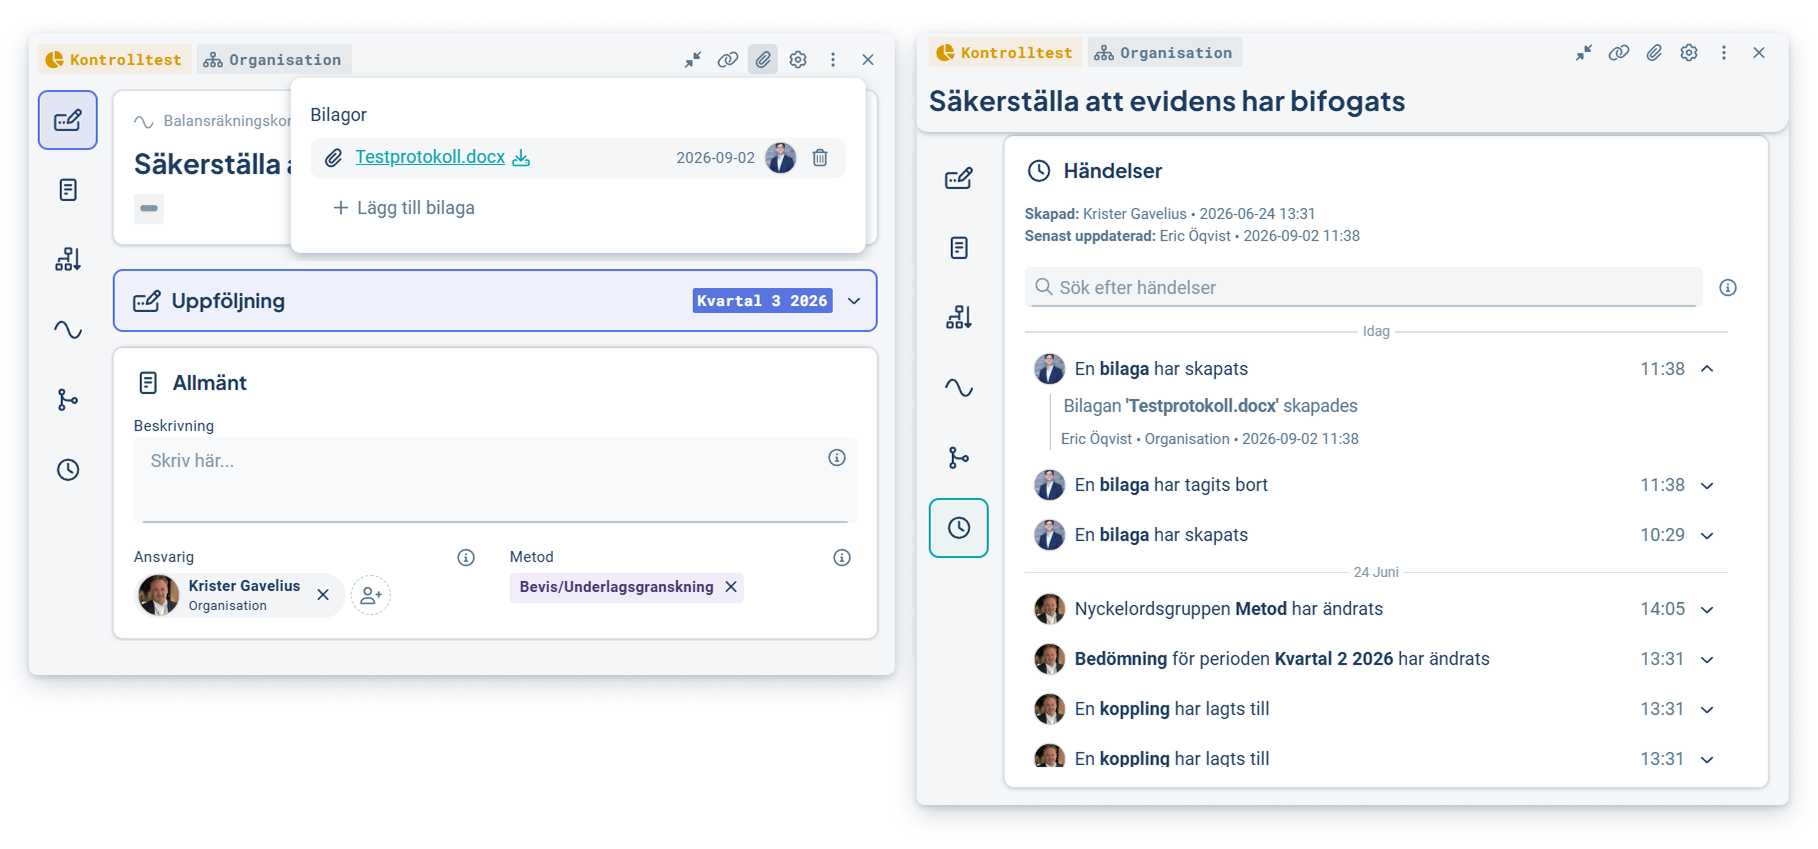
It is now easier to view attachment information and track changes over time. In the object drawer, you can see who uploaded an attachment and when. In the event log, you can also track when attachments have been added or removed.
- See who uploaded an attachment and when.
- Track when attachments are added or removed via the event log.
Activation: This feature is automatically available and requires no activation.
Forms
This feature is included in the product license.
Forms - Export checklist results to Excel
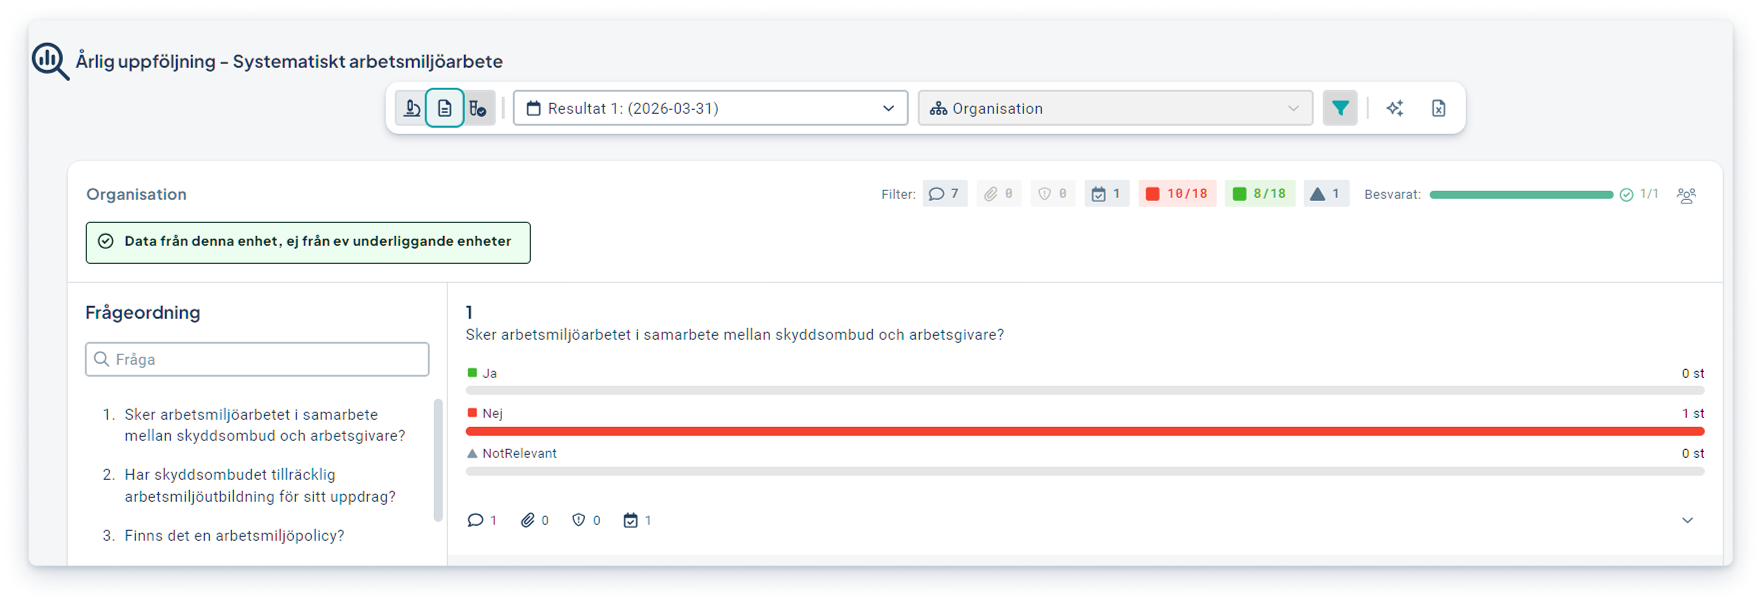
You can now export the results from a checklist in Forms directly to Excel. Before exporting, users can filter the results—for example, by selecting which departments to include.
The Excel export reflects the filters that have been applied and provides a clean dataset for further processing, analysis, and follow-up.
- Facilitates further analysis of checklist results in Excel.
- Saves time since the export is based on pre-defined filters.
- Provides a clear foundation where questions, answers, comments, risks, and actions are presented in a structured manner.
Activation: The feature is automatically available and requires no activation.