Formatting External page Target goal chart
General Color Mesurement columns
Responsability roles Information Name
Reconciliation dates Comments Number
Description fields Consolidation Keywords
Verktygsikoner Other Properties in Archive
The Node properties is used to select the information to display in each column of a view or report part. You pick out the properties that are most useful for the particular purpose. Some node properties are only useful in columns of a special type. For example, activities have been Their special node properties and dimensions, too. In the list below, those that are displayed only for a specific scorecards column type are excellent with icons for:
Node properties are divided into different categories. The following describes most node properties that can be selected under each category. You always have the option to go back and change your mind if you are not satisfied with the results in the view or the report part.
Obs! Please give feedback if you do not have a description of a particular node property.
 Formatting
Line breaks
Add a line break between the different parts of the composite node properties.
Increase Indent
Add a distance where the formateringselementet is used. example, as an increased indent before a name.
General
Implementation, Budget, hours, start date, end date, reconciliation date, prioritization, etc.
Displayed for activity columns if these fields are enabled on the General under Aktivitetsinställningar.
Ansvarsroller
Responsible
Lists the names of the people who were added as managers in the manager role on the node, under the heading Responsible. Is Ansvarsroller.
Responsible
Displays all managers from the responsibility role that is set to the default role, under the heading Responsible. Is Ansvarsroller.
Own responsibility Roles
All of your own responsibility roles that you have created are available to choose from. The names of the people who are responsible will be displayed under a heading with the name of the responsibility roll.
Avstämningsdatum
Avstämningsdatum
You can choose whether to see only the record dates or even their descriptions.
Displayed for activity columns if this field is enabled on the tab General under Activity settings.
The description fields that you have created will be available to select in the view. The text in the description will appear with the name of the Description field as the title.
BudgetDateA chart appears in the View/Report part with the name as the title. The chart becomes clickable and opens directly in the view. The chart is interactive for users who can choose to display ex. Associated comments or choose which columns to compare.
Chart without title
A chart appears in the View/Report part without a title. Used, among other things, in report parts to ensure that the name is not displayed for both the measure and the chart. Otherwise the same functionality as Diagram.
Chart icon 
Opens the chart in the view. Provides the same interaction options as when clicking on a chart.
Chat display icon
Displays an icon that links to a custom page that displays charts and comments. The page has limited functionality compared to charts displayed with the above node properties. Can be exported to PDF and Png.
Documentation icon 
Displays a document icon where documents are uploaded to the node. Clicking the icon displays a clickable list of the documents and a link that opens the tab in the node.
Units
Other unit
Displays the unit name of the unit to which the node belongs (its root), if you are on another unit in the organization tree. If the node is visible to Unit 1, and we are on Unit 1. To display the unit name of the unit on which it is created.
Unit
Displays the name of the unit to which the node belongs, under the unit heading.
Unit designation
Displays the drive letter of the drive that the node belongs to under the heading unit. Is Change a unit.
Visible units
Displays a list of all units to which the node is visible under the heading Visible units.
Export
Unit ID
For questions about this- Your consultant.
Unit id Current Unit
For questions about this- Your consultant.
External page
Here you can choose to add a link to any of your External pages.

Information
Period
Displays the period for the node. Based on the period settings of the viewer or report. See Period Settings in views And Create Standing Report.
Period, start Date
First date of the period (does not care about any shifts)
Period, End Date
Last date of the period (do not care about any shifts)
Next reporting
Under the report last title, the date when the current period has its end date is displayed. Always goes on the current period and listens to shifts for reporting of måttdata.
Start Period for Reports
Displays the start period that is specified on the Inställningar tab in measures.
Color Range
Prints if the color of the measure is based on the smaller the better or the bigger the better. The field is left blank. See also color settings.
Periodicity
Use suggested measures to determine which measure uses the periodicity.
Comments
Show more/less on long comments and description fields
Comments and Description fields display up to 11 lines of text then the text "show more" is displayed, which you can click to see the remaining text.

Check marked 
Displays the icon if the current comment is completed.
Comment
Displays the current comment. Listening to the View/Report period setting and filtering. Appears under the heading Comment.
Comment (with title)
Displays the comment italic under the heading Comment.
Displays the last comment within or before the period specified in the View or report.
- Obs! The period for the comment is not always consistent with ex. Period of measure columns if the node properties Last comment is used. Do you want these periods to always be consistent, we recomment node propertie comment Instead.
This year's comments
The comment heading shows all comments that have been written in the current year. The comment is grouped in the period in which the comment is written.
 Consolidation
Consolidated units
Displays a list of the units to which the node is consolidated. Appears under the heading Consolidated units. It is also possible to choose the composite node properties Name + Consolidated units Where the title instead consists of the name.
Consolidation 

Displays an icon if the node is consolidated. Click the icon to open the node's consolidation view. Followed up on this or overlying units. are followed up on underlying units.
Consolidation root
Displays the name of the top unit in the consolidation chain.
Consolidation chart
Displays a table of the entities in the consolidation chain, its column values, and period.
Connectors
Red Thread 
Displays a red icon in the view. At MouseOver for the icon, the entire connection chain of the node is displayed.
Linked to
Displays the name of the closest join in a column used in the View/report.
Scorcards
Prints the name of all the scorecards to which each node is selected/attached.
- Obs! If you have this feature turned on and using this node property, the view might be slow to load.
Source systems
Node properties used for export and importviews.
Contact your consultant for questions regarding these nogegenskaper.
- Obs! We recommend that you use Node properties with the same name as your source system before Node properties "External codes for measures" as these have better custom functionality.
Source System icon
Used to display an icon for a source system, the idea is to easily visualize which source system a measure in the Stratsys integrates against.
Links
Links are used to go directly to another view with the selected node already filtered. Contact your consultant or Stratsys support if this node property is not activated with you.
Choose which view you want the link to lead to and whether it should look like an icon  View name to be printed as text.
 Meter
Meter
Displays a gauge that points to the color that is set for the node.
Goal indicator chart
Indicator shows a graph of an average color for all measurements that are associated with the target per unit. The color is visualized with a percentage value in the same way as in Control room. Red = 0p, yellow = 0, 5p, green = 1p. The total score for all measures is summed and then multiplied by one hundred to obtain the value of the meter. Measures that have no value in the current period are not counted in the count.
Number of activities
Counts the number of activities directly linked to this particular node (without the intermediate led).
Target attainment (number)
A mean number is displayed based on the color or status of the selected columns. Enter the number of subsequent scorecard columns to be counted.
Mesurment columns
Measure Column Name
Here you can see a list of the names of all the different columns of data contained in the measurements in the scorecard. It is common for ex. bleed and target achievement to appear.
Many different measure columns, it is because the measures are not only based on the same Måttmall But have also been individually adapted. If a measure column is added only to a specific measure, the column is blank for the remaining measurements.
Target column, forecast column, and bleed column
If you select any of the target column, forecast column, or bleed column, values from the columns in the measurements that are defined in TAB: Measure column Locking. Therefore, nodes from different scorecards do not have the same name as long as they are added as this column's.
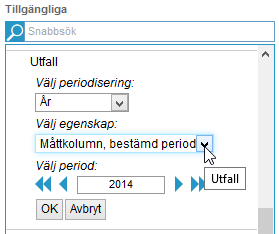
Measure column, Fixed period
A measure column with a specific period is used to create a view or report part that compares data from different periods to each other in different columns. This may be the outcome for different years or different months. Click the Node properties in the list on the right and then specify which periodicering to apply if you want to select a specific or a relative period and which year this node property will show. Selecting the relative period allows you to select the number of periods forward or backward compared to the period of the or report part.
Measure column, Response options
Node located in Measure column Distribution, mesurement column And Measure column, Response options Used only for checklists and is therefore described in a separate article.
Name
Displays the name of the node without tilläggsformatering
Name (comment)
The name becomes a clickable link leading to the reporting mode.
- Obs! Not used in drag N drop views or together with InlineEditing.
Name Bold
Displays the name in bold
Name without number
Applies only to those who have the function number enabled. See tab: Settings for selecting nodes.
Obs! Appears only if you have this feature turned on. See Settings for selecting nodes.
No
Appears under the heading number.
Number links
Appears under the heading number. The number is clickable and opens a översiktvy for all reporting units.
Keywords
All keywords
Displays all keywords active for the grouped column under the name of the keyword group as the title.
Keyword icon
Displays all keyword icons from all keyword groups active for the column. It is not possible to display only one icon from one of the keyword groups. No title is displayed.
Own keywords
All custom keywords that are active for the column are available to select in. The selected keywords will appear under a heading with the keyword group name.
Priority
Displayed for activity columns if this field is enabled on the tab General under Activity settings. Displays the value printed as text.
Risk
Node properties for risk is only used in view type is Riskmatris. This property is described in a separate article. See Node properties for risk matrices.
Hours
See the article about the tab General under Activity settings. Appears only if it is enabled during activity settings.
Trend
Shows trends for KPI nodes.
Follow-up window (Icon) 
Displays the icon to open the node's Rapporteringsläge. See Also Change a column in a view.
External link
Appears only if you have the functionality External links Enabled. Displays an icon that links to another view that is filtered to show only the node you clicked. For questions, please contact your consultant.
Color range
Prints if the color of the measure is based on "the bigger the better" or "the smaller the better". If "Interval" is used, the field is left blank. Node properties can only be used in exportview.
Scorecard columns
Prints the name of the scorecard column and the column type (in parentheses).
Wrench (Icon) 
Displays the icon to open the node's settings.
Properties in Archive
If you previously created sections that contained several different properties or a property combined with a formatting , these are saved in Archive. They appear as the property's name + the name of the next property or formatting. For example, "name + comment". Click one of these to use the section with the same settings as before (in addition to the settings made in the Report section If you click  Brush. (It Appearance (brush) settings)