A new report part can be used to build reports based on information from scorecards. For example, you can choose to retrieve targets as headings in the report, followed by tables with the metrics associated with each goal.
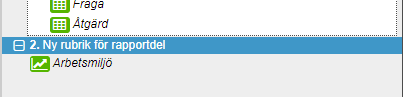
TIPS! We recommend that you create a title in the report that you then put the report part under. This is so that the report part can be moved at a later date. Report parts that are created directly at the top level of a report cannot change position relative to manually created headers at a later time. Heading 5. For example, it is difficult to move it so that it becomes heading 6. See Report part: Copy report part To copy the report part so that it is below a manual heading instead.
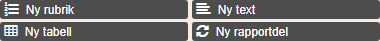
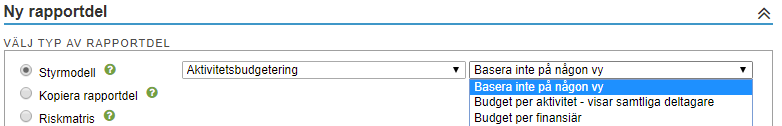
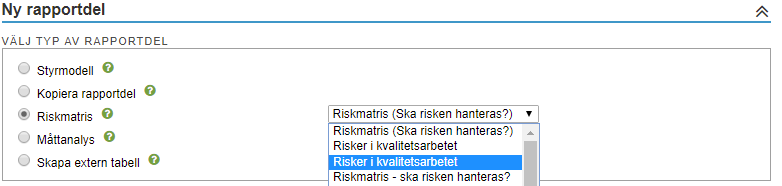
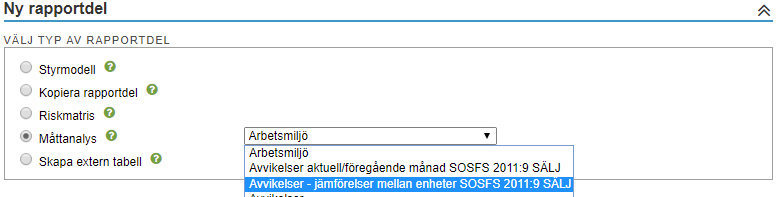
Start by selecting the title you want the report part to position below and then click New report part. Then follow the wizard through four different steps:
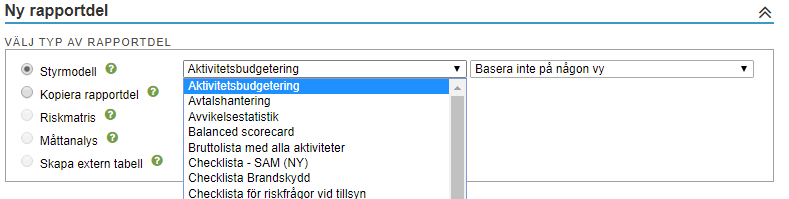
Step 1-General
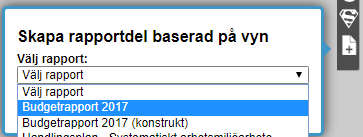
Via The drop down menu, you can select the desired scorecard.
You can also choose to base the report part on a view that is currently set up today based on the scorecard. This means that the Nodegenskaper and filter settings for the selected view are copied to the report part.
Next, tap create in the top right
Obs! This is a snapshot created by Nodegenskaper and Filter settings, if you later change these in the view, the settings for the report part will not be affected.
Step 2-Columns
Here you can select which of the scorecards columns to retrieve into the report by clicking the check box in front of the column name. You also specify how the column should be used in the report. Columns with node Text are set by Stratsys per default to headings while dimensions and activities are set as their own table, you can of course adjust these in retrospect.
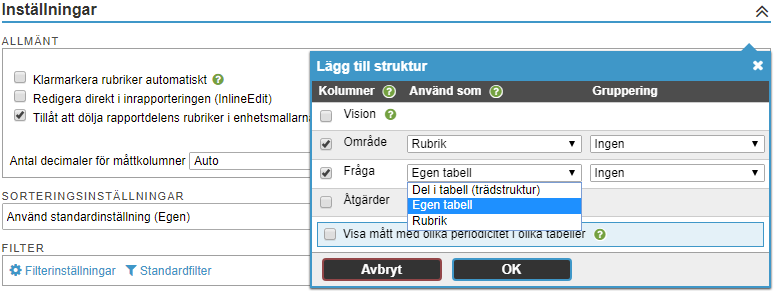
is used as
Rubric -If you select "title", the information from the column will appear as your own headlines in the report. If you select "Use as heading" for multiple columns, the columns will be different heading levels in the report. Ex. KF goals as heading level 1 and the RAC's goal as a heading level 2 similar to the information displayed in views.
Separate table -If you choose "Custom Table", the information in the column will be in its own table. For example, a table for all metrics and maybe even one for all activities.
Part I table (tree structure) -The columns that you use as "part of table (tree structure)" are in the same table and the links between the data in the different columns are clarified in a tree structure. You can, for example, choose to display your nodes and their merged measures in the same table. The following example shows two text columns ("Business objectives" and "destination of the unit") and a measure column ("Metrics")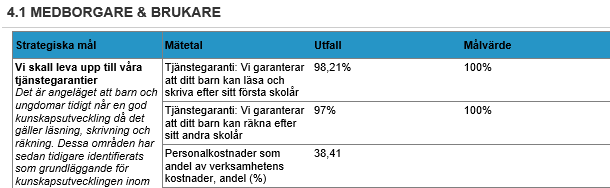
Grouping For both headings and tables, you have the option to specify that they should also be grouped under a custom free text heading or a keyword group. Select Own headline and enter in the text box what the title should be called. For example, for a target column, you could have a Grupperingsrubrik named "Follow-up of our goals." If the column has keywords set, you can also choose to group under each keyword-either as an overheading or as an introductory grouping column inside a table. Then select Keywords as a title Or Keywords in table And then which keyword group you want to use.
Show measurements with different periodicity in different tables Divides the measurements so that you have the option to set different nodegenskaper for each periodicity. If you check this option, you can select the periodicity that you want to display in the report part. See also change report part.
Step 3 properties in the Property picker and settings
You can later adjust the nodegenskaper you have selected.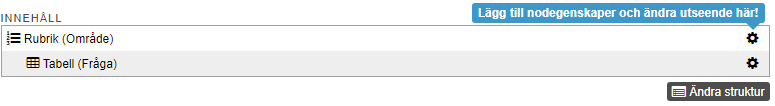
For each scorecard column that you select, you now have the option to select which properties to display in this report part. Scorecard columns that appear as headings have only one field, but those that are displayed as tables have two (one for the contents of the table and one for any content that you want to display as additional information below the table).
To add or remove properties in the property picker, see: Select and change combined properties in views and report parts with the property selector.
Properties under a heading
For report part headers, you set properties the same way as in the tables with the slight difference that the sections are listed by each other instead of in columns when they appear in the report itself. You do not need to select the Name -it always appears automatically for headings. See Select and change combined properties in views and report parts with the property selector.
Additional Information under Table
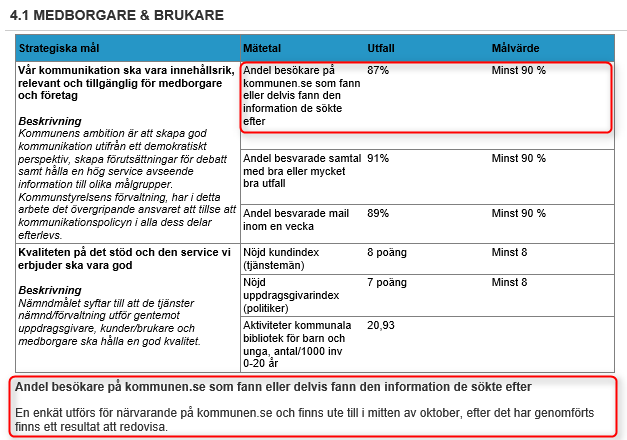
If a report part retrieves long pieces of text or, for example, large graphic elements such as Images or diagrams, it is common for these to be listed below a table cell instead of inside a table. This content is administered in the same way as the contents of the table. The property selector for a report part always allows you to Supplement with information to be displayed below the table. See the sample image below.
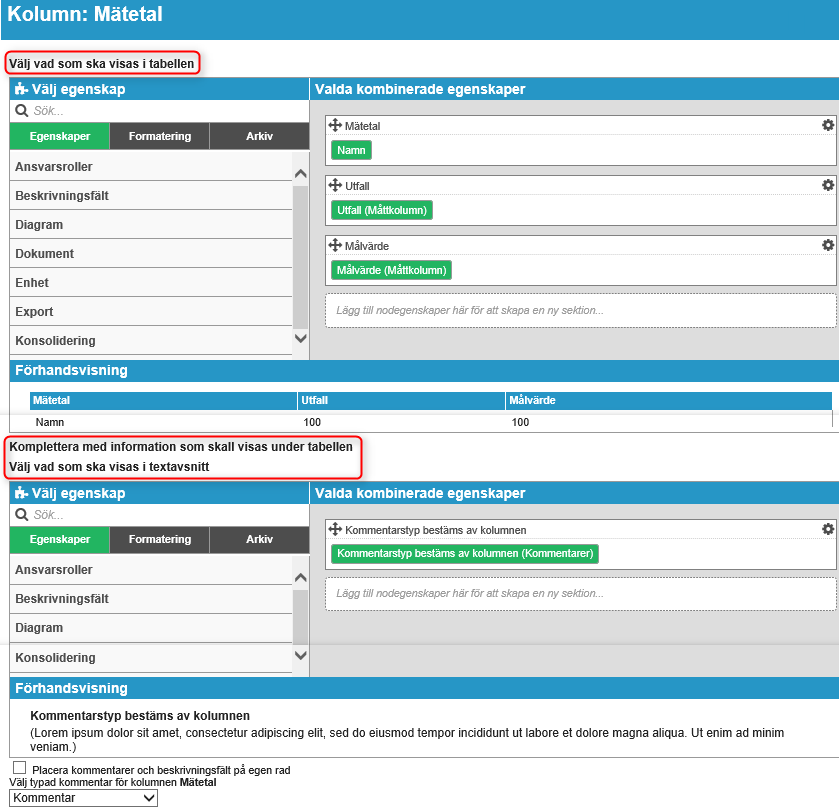
This example uses the Comment As supplementary content below the table. See the image below that shows how Mätetalens comments are displayed per metrics below the table (which in addition to the measure ETA also shows the strategic objectives that the measurement ETA is linked to and therefore is not suitable so well to also contain comprehensive mätetalskommentarer.
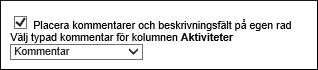
Place comments and Description fields on your own line (inside a table)
You also have the option to specify that all comments and description fields appear on a separate row inside the table, thereby freeing up space horizontally for other content.
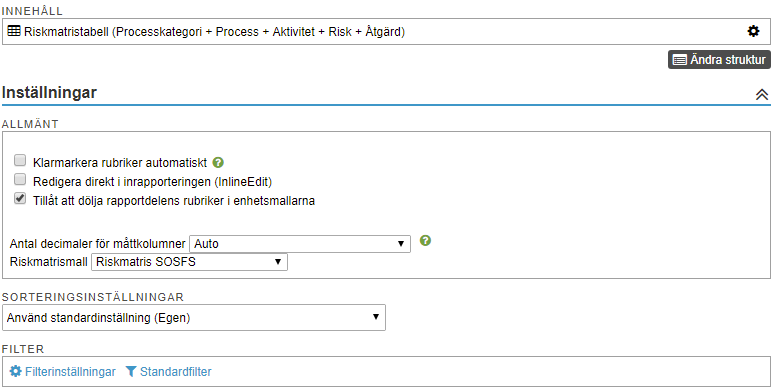
Settings 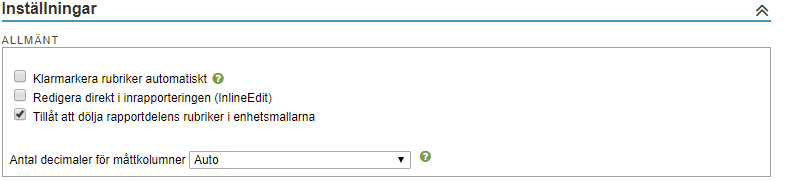
 Klarmarkera headers automatically
Titles in the report part Klarmarkeras automatically if this setting is enabled and the header does not contain any sections that the user will report on, or if the header contains only klarmarkerade comments. If you have two approval levels on the report, the header Klarmarkeras for approval and you have one will header Klarmarkeras. Headings that are already klarmarkerade (if you change in a report part) do not lose their clear selection regardless of which setting you are doing here. For information on the clear marking of comments,
Edit directly in the reporting (InlineEdit)
Makes it possible to edit directly in the report.
Report part: Copy report part
Obs! If you copy a report part, content that is added manually in the report part is not copied. For example, headings added to the unit customization of a report part created from the report template or manually added text fields are not copied.
Step 1
Select the heading to place the copied report part under. 
Obs! Never place report parts in each other as it will cause problems with hiding/showing and splitting down to the underlying.
Obs! Ideally, do not create report parts right under the root heading because only headings can be distributed to underlying reporting entities.
Step 2
Select the report where the report part is listed in the next step, select the report part, and then create.
Step 3
Now you have the option to change the Nodegnskaper, structure, settings and default filters then save you.
Report part: Based on view