Scorecards
The scorecard is the structure where your data is defined and stored. The views visualize and enable processing of this data.
A scorecard consists of a set of columns with different properties that are interconnected, where you can store information in nodes/objects.
The scorecard can, for example, be used to create your organization's goal breakdown structure.
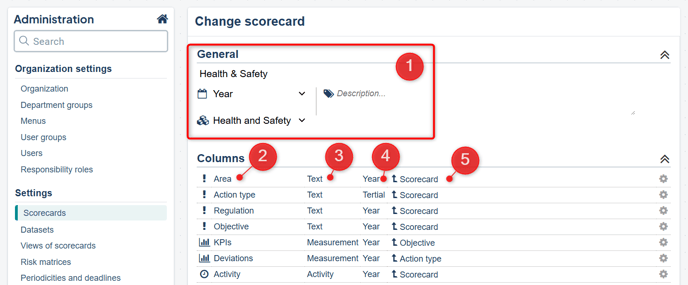
A scorecard has a name and possibly a description, a periodicity that becomes the standard for all columns, and can be linked to a product (1).
The columns have a name (2), an object type (3), a periodicity (4), and can be connected to other columns within the scorecard (5).
All information created and stored in a scorecard is created in an object within a specific column. Objects are therefore the carriers of information in the scorecard, and can, for example, describe a goal, a measurement or an activity.
Views
A view is a set of properties and filters that makes selected objects from a scorecard available.
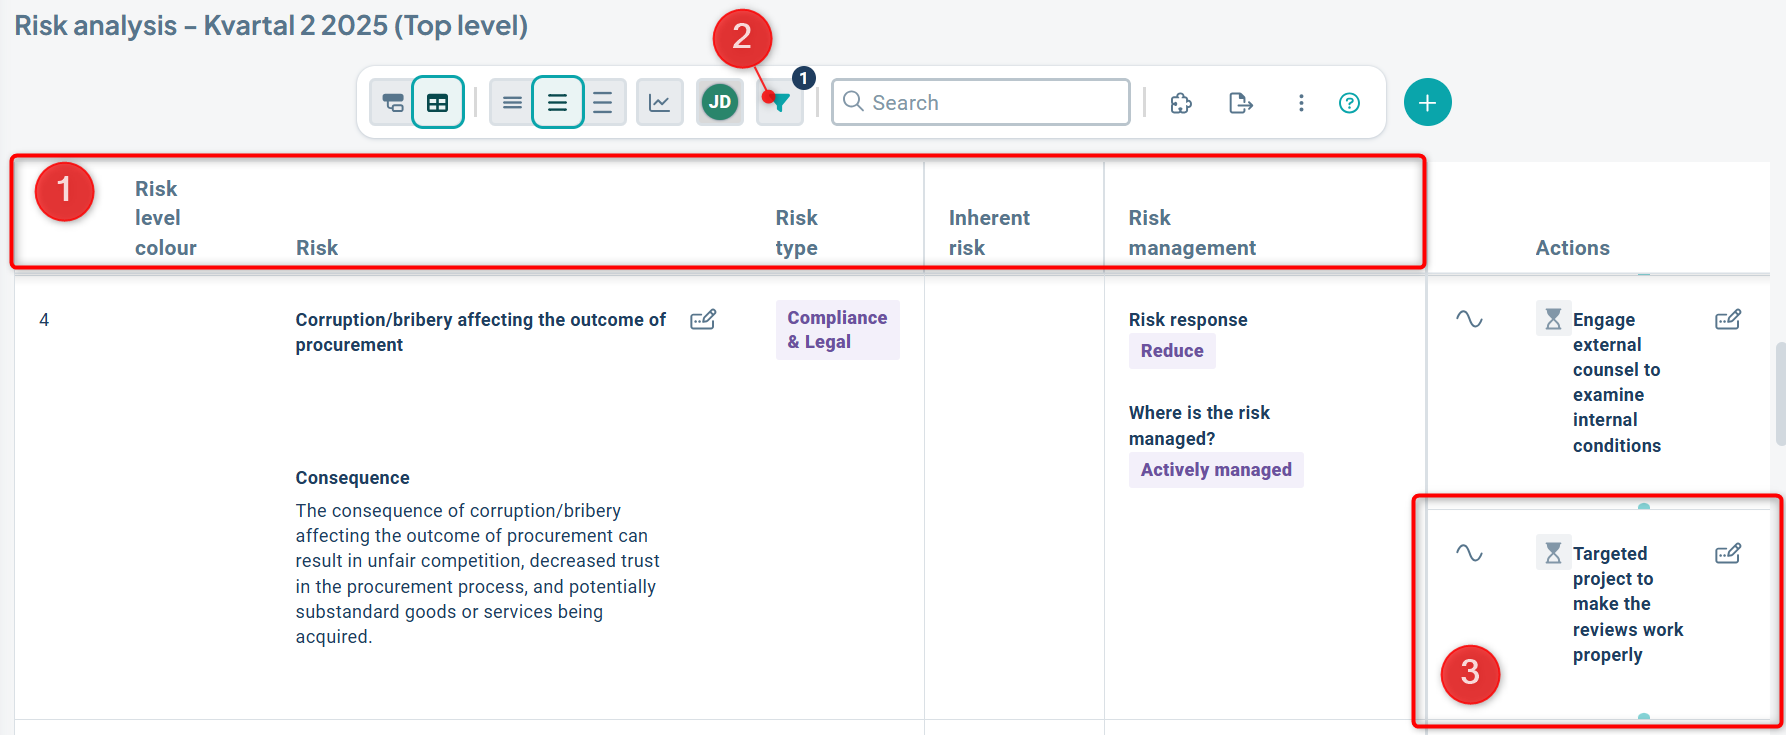
The view displays one or more scorecard columns (1), selected objects via filter settings (2), and selected parts of the information available in these nodes/objects (3).
The different views are tailored to various tasks and processes for which the information is used. In some views, you create information in others, you update information and monitor your nodes/objects, while some views are purely informative and compile information in visually clear ways.
Different views belonging to the same scorecard show information about the same unique nodes across all views. If you make changes to a node in one view, the information about that node will be updated in all other views
What happens if I copy a view?
If you need support for a new task or process for your information, you can copy a view to create this support.
When you copy a view, you are copying the set of filters, properties, and other rules for how the information displayed is organized.
If it is the actual information in a node/object that you want a copy of, you can achieve that by saving that node with a different name. You cannot copy the information in an entire scorecard with one click.
How do I access the views?
The views are grouped into different menus. Which users can see each menu is determined by the User Groups the users belong to and which menus are visible to these user groups. In this way, you can create customized menus with corresponding views for different target groups within the organization.
What different types of views are there?
Views can have different display modes where the information can be shown, among other things, as a workspace, table, a tree structure, or a Gantt chart.