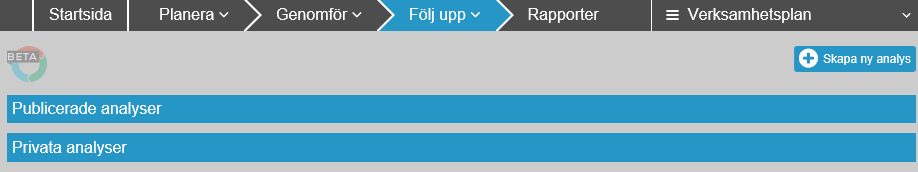
Create new analysis -To create a measurement analysis, click Create New analysis
Private analyses -Displays the KPI analysis you have made and chosen to save. You can copy saved measurement analysis and publish or delete them the same.
Published analyses -Displays the Private analyses That you have chosen to publish and thus make visible to everyone with access to the measure analysis view. Published analyses can also be used to display the chart as a gadget On Dashboarden, how to add a gadget You can read about here, Add a gadget to a dashboard.

Here you have the opportunity to perform your Måttanalys:
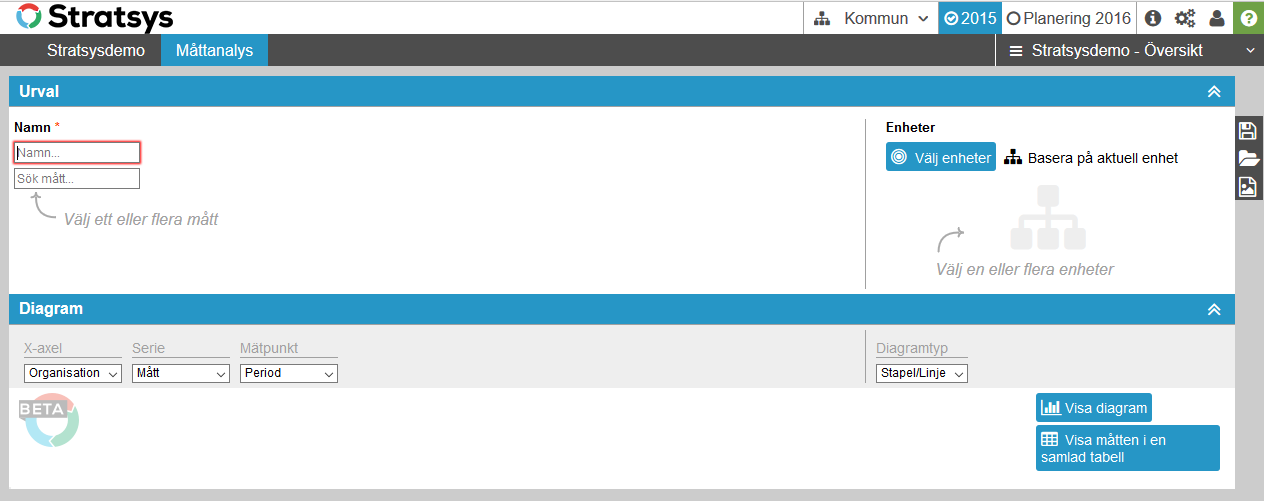
Name -Here you specify what name your measurement analysis should have.
Search metrics... -Find the measurements you want to add. The measurement list Limited in its search as you write your text and cover all the dimensions in your database. You can add as many measurements as you want and you remove the measurements by the white X for each measure.
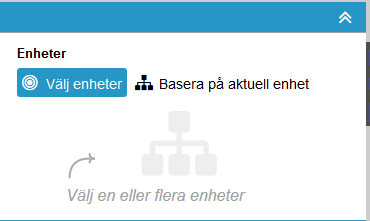
Devices -Here you select to Limitera the number of measurements in search measures based on unit level.
Select devices -You can select units based on the organization selector, you do this by clicking the gray icon for the organization tree, then clicking the desired entities in the organization selector.
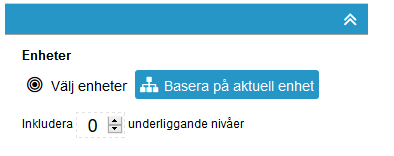
Base on Current drive -means that you limit the measurements to those that are at the unit level you are currently on. Here you can also choose to include any number of underlying unit levels.
Series -Specifies the unit to be displayed for the series you can choose between organization, measure and Period.
Measuring point -Specifies the unit to be displayed for the measurement point you can choose between organization, measure and Period.
Diagramtyp -You can choose to display the chart as bar/line or spindle
Måttkolumn -Here you can depending if you selected chart type bar/Line choose which of them the respective measure column should be displayed as.
Visa Diagram -To see the measurements as graphs, select Select Visa Diagram
Display the measurements in a single table - Select this option if you want to see the measurements in an aggregated table, or below the chart, or as just a table.
Periodväljaren -the period used in the chart appears above the chart, and you can select the desired period.
Show stacked -By clicking in Show stacked Displays the data in the chart stacked instead of as individual columns.

Once you have completed your measurement analysis as desired, you can choose to save this it is done via the Black toolbar in the top right.
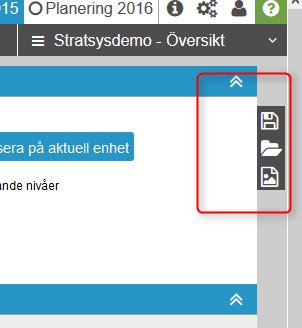
Sparaikonen -Here you can save your measurement analysis, the saved measure analysis ends up in Private analyses
Saved - Here you can choose to öpna any of your tidgiagre saved Analysis of measurements from private analyses
Export as Image -Here you can choose to take out the chart as an image.