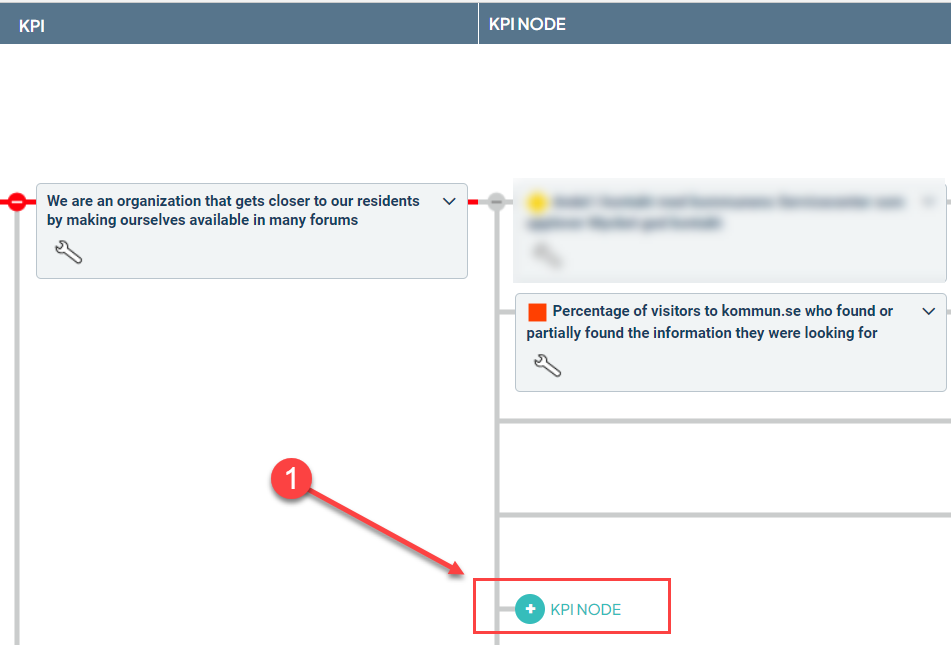
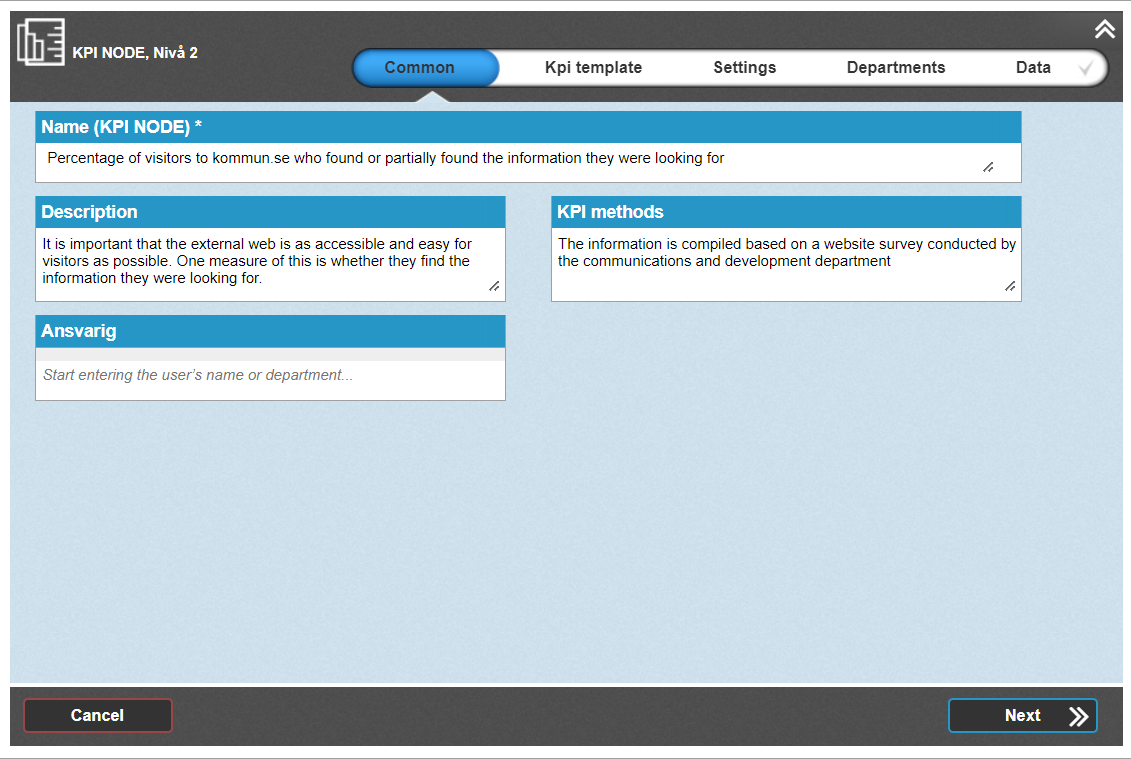
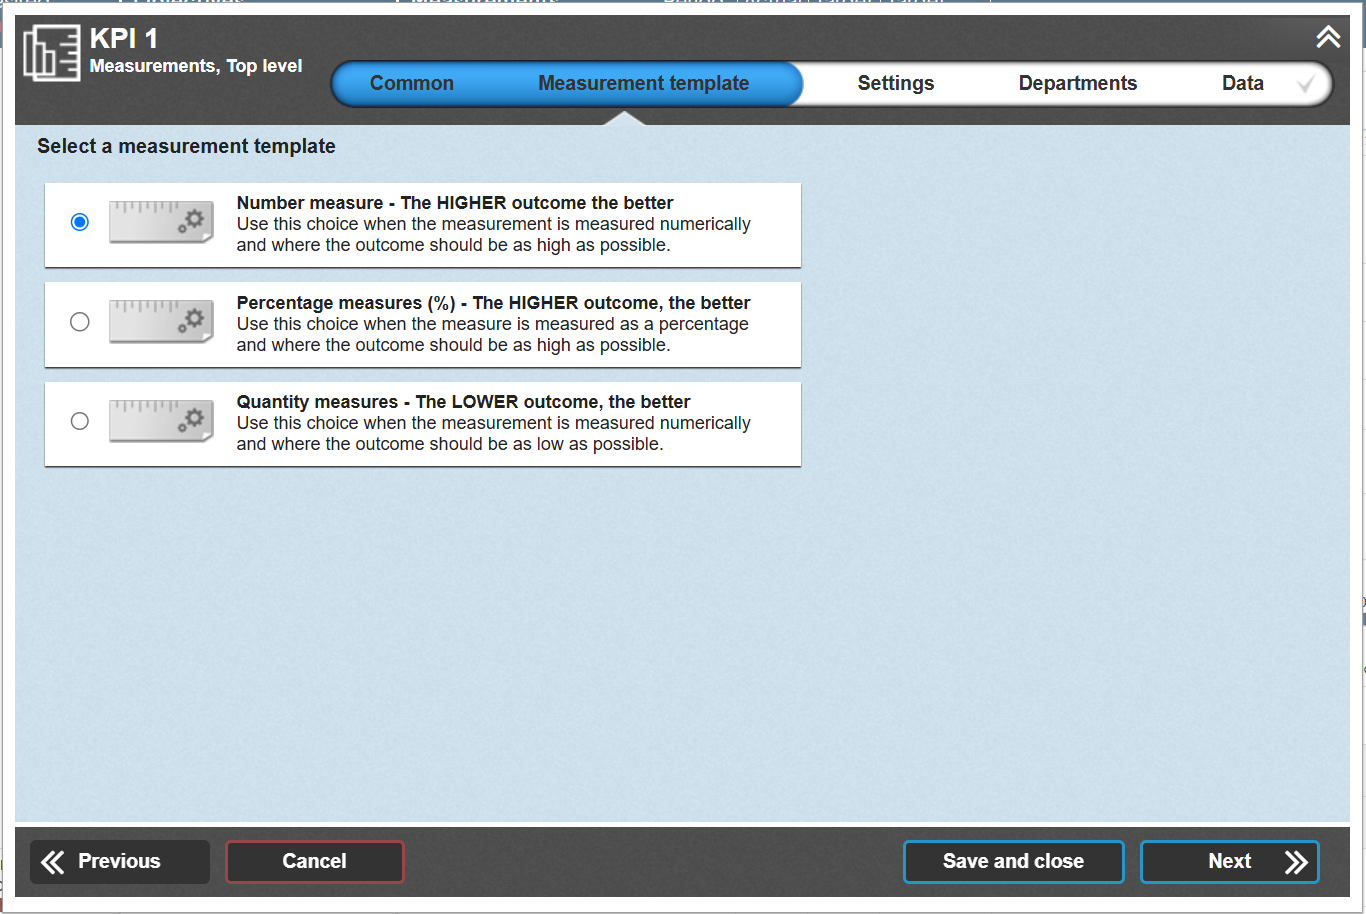
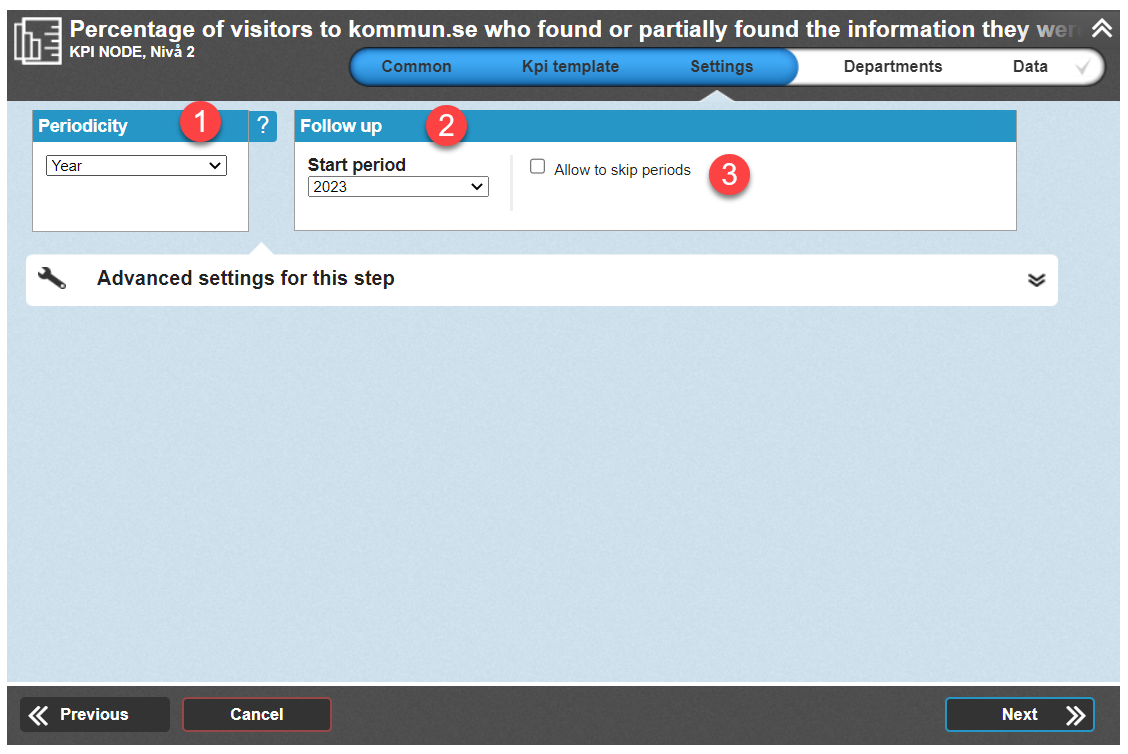
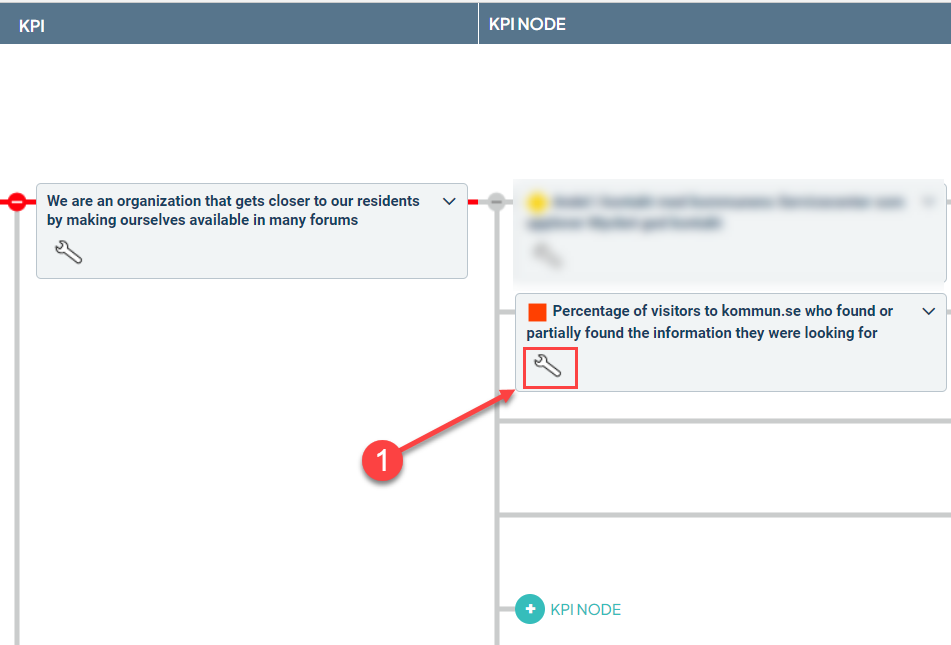
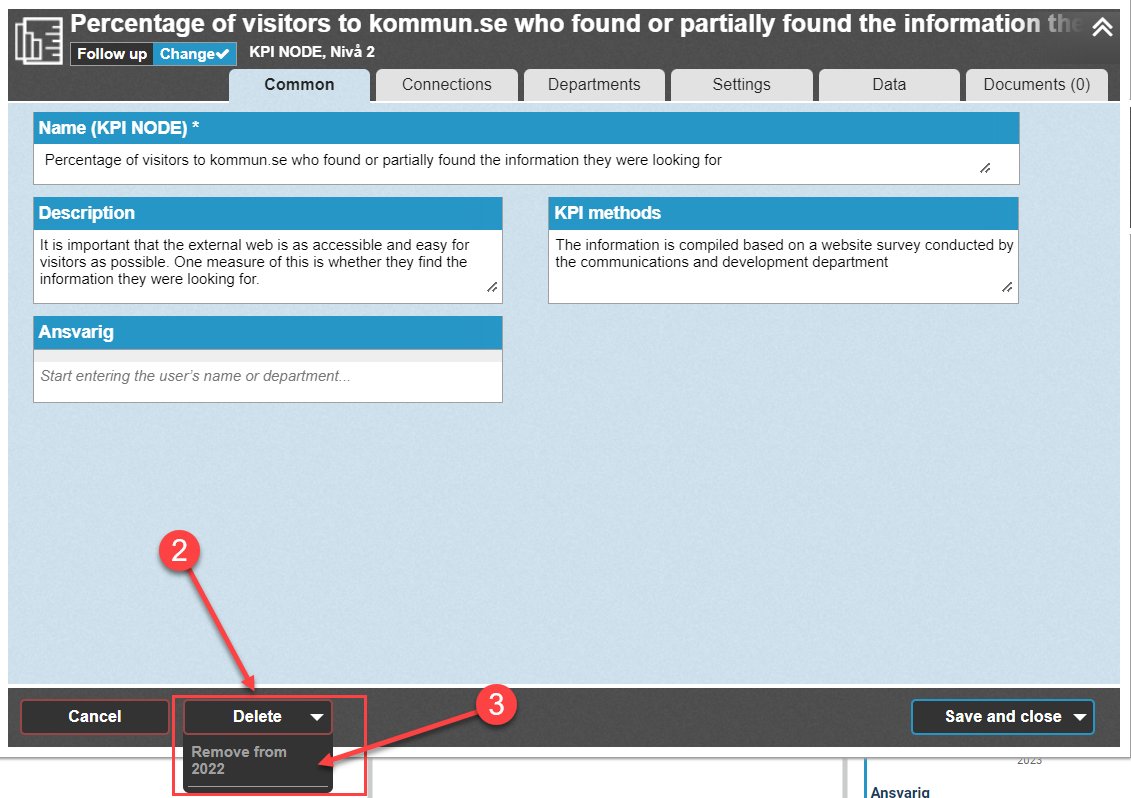
How to add and edit KPI nodes

A KPI node is one of the three node types found in Stratsys that are used when data or response options are needed

Quick links:
 
 
KPI are often used as a way to measure how well the organization is reaching a defined goal. In Stratsys, KPI's are used to measure something at a certain periodic interval, either using data or predefined response options.
A KPI node has all the components that a text node has. In addition to this, there are columns where users can report different values ​​at regular intervals. It is common for measurements to be structured in such a way that users report e.g. outcome and target value. Several KPI's are often set up in a similar way and can be based on Standard KPI.
In addition to data, KPI nodes are used for risks and checklists, where the user fills in their outcome/assessment based on response options.
Users also have the opportunity to e.g. write comments that are related to e.g. the period's outcome. At the end date, those in charge can receive reminders from the system.
Common names of columns that contain KPI nodes are indicators, KPIs, risk, steering KPI, and metrics.

Add a KPI node

To add a new KPI node, you must start from a build view. 
In the build view, click the blue link Add < level name > Below the level and on the line where you want the new KPI node to be located. After you click the button Add < level name >, Opens a window with five tabs: General, connectors, consolidation, definition, and data.


Step by step Guide to creating KPI nodes

To make it easier to create, copy, and consolidate KPI's, we have developed a step-by-step guide where all the settings are in the order in which they are to be performed.


Step 1: Tab - General

Read more about the tabs in general in Text nodes

Step 2: Tab - KPI Template

In this tab, you set how the KPI node is supposed to be measured by selecting a KPI template. In Stratsys, there are a couple of predefined KPI templates that are ready to use. They are set up to measure the entered data in a specific way, so that an extra fund is added when choosing a KPI template as it cannot be changed when the node is saved. You can also create new KPI templates in the administration. Click the link to read more about KPI templates.

In the example below, we want to measure how many visitors found the information they were looking for, from that we choose the KPI template "The HIGHER the better" and want the result to be shown as a percentage.


Step 3: Tab - Settings

In the Settings tab, you can make general and more advanced settings that affect how we will work with the KPI.

1. Periodicity

In the periodicity drop down, the interval at which the KPI measurement is to be reported is selected. Usually there are several options to choose from, but which ones appear in the list also depends on which Periodicities that are created from your setup. 

2. Follow up

Here you choose which period the follow-up should begin. The choices available are determined by the previously selected periodicity.

3. Allow to skip periods

If it should be possible to skip a period (for example term 2) in reporting, check the box. Otherwise, follow-up is expected to take place continuously according to the selected periodicity.


Advanced settings

As previously mentioned, it is not possible to change the choice of KPI template once you have gone through all the steps and saved the dimension node. However, you can make corrections in the settings for the particular node you create. Note that you are not making changes that will affect all nodes using the measurement, these advanced settings only apply to the node in question.

A. Columns

The columns define how data is entered into the KPI and any calculations that are made inside the node. Here you will find all the available calculation formulas and how they can be used.
In the case below, it is preselected according to the previously selected KPI template to have the three columns Result , Goal, Goal achievement where each fulfills its own function:

Result: In this column the user enters data.

Goal: The user sets the goal to be achieved.

Goal Achievement: A column that uses a calculation formula to calculate how well the goal has been achieved. This is done by using the previous two columns.

B. Colour settings

Depending on how well the measure is achieved, there is a color coding that appears in the follow-up window or in the view. Without having to review reported data, the color gives a good overview of how well the work went. Here you change which column the color should be linked to and which of the three colors are selected depending on the numbers entered in the fields for each color.

C. Trend Arrow

Trend Arrow can be considered as a complement to colors in views, alternatively replace them. A trend arrow appears in the measure view and shows positive or negative trend depending on the data entered during previous monitoring.

D. Chart settings

Dimensions are often visualized in the form of diagrams. If you wish to adjust which columns should be used for the diagram, or which style it should have, you make the settings for this here. Read here about how the chart settings work under Charts.


Step 4: Tab - Departments

Like other nodes, KPI nodes can be copied to underlying entities to be consolidated. It is something that often occurs in measurements where a unit collects data from underlying units and compiles the information. If the user chooses to fill in units at the underlying level, the KPI will be consolidated to the units and follow-up is expected to be done according to the previously selected periodicity.