In the follow-up window, you report by adding comments, entering data, and changing status. You’ll find instructions, supporting materials, and history to assist you in your work.
Datas and Information Section (Right Side)
Additional Features in the Follow-up Window
Description
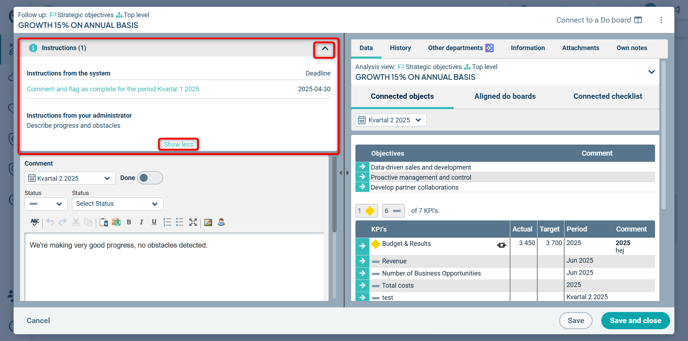
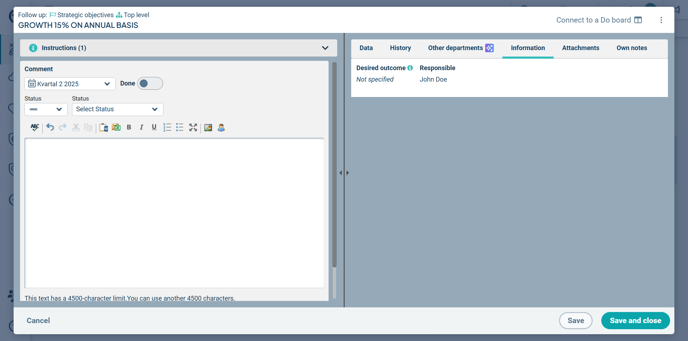
In the Follow-up Window, you carry out follow-up by commenting, entering data values, and changing status.
The window consists of two parts. On the left side, you perform the actual follow-up. Here you will find instructions—both automatically generated by the system (system instructions), which describe what follow-up is expected, and instructions specific to your organization.
System instructions are only shown to users with follow-up responsibility when the follow-up window is opened, while manually entered instructions are always displayed.
On the right side, the datas needed to carry out your follow-up are shown.
You can access the follow-up window in several ways from the new view:
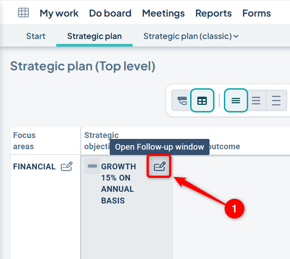
1) Follow up by clicking the “pen and notepad” icon to the right of the object’s name. This opens the standard follow-up window.
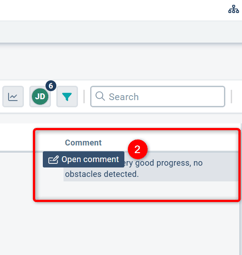
2) Hover over an existing comment. A tooltip saying “Open comment” will appear—click this to edit or supplement the existing comment. Note that some text belongs to description fields—these are accessed by clicking on the object itself.
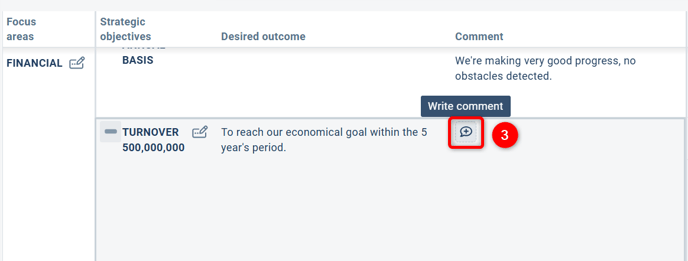
3) Hover over a spot where no comment exists. A tooltip saying “Write comment” will appear—click this to write your comment. Note that some empty fields belong to description fields—these are accessed by clicking on the object itself.
Follow-up Section (Left Side)
Instructions
At the top left, the instructions are displayed. These may be both automatic (system instructions) and manual (instructions from your administrator) in the form of text managed by a global administrator. The manual text can be modified to reflect changing needs or requirements within your organization.
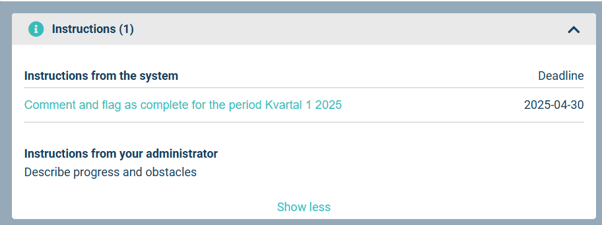
- The instructions can be minimized or expanded by clicking the grey bar at the top.
- For administrator-provided instructions, you can also select “show more / show less” if the instruction contains a large amount of text, as not all text is displayed immediately.
System Instructions
The automatic instructions provide guidance on what needs to be followed up.
-
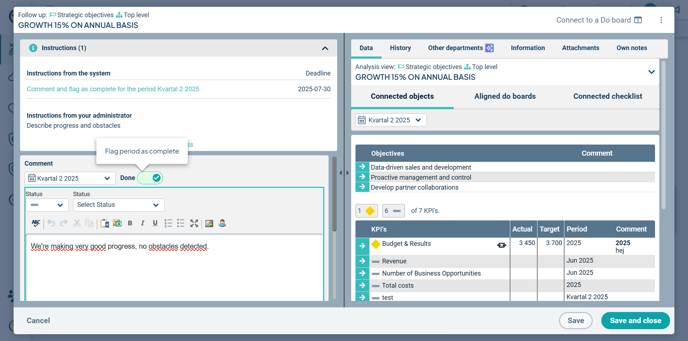
Numbers in parentheses indicate that something needs to be done before you can complete the follow-up.
-
Instructions are clickable, shown in turquoise text (a link). When you click a system instruction, the relevant area is highlighted and a box appears with details on what needs to be done.
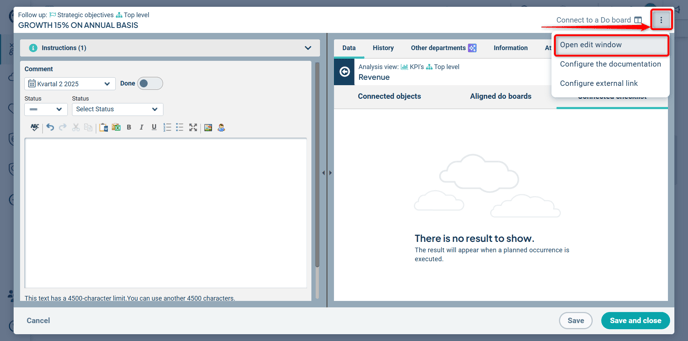
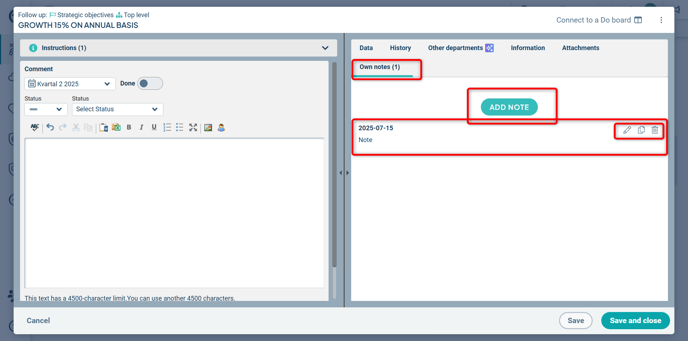
In the example shown in the image, we have clicked the instruction to write a comment and marked it as complete.
System Instructions Are Based on the Following Settings:
-
Responsibility roles and their configurations
-
Follow-up deadline settings
-
For measure follow-up: which measure columns are designated as Actual, Forecast, or Annual Target columns
-
The completion marking feature
Instructions from your administrator
These instructions are configured by a global administrator under:
Administration → Comment Settings → Instructions.
datas and Information Section (Right Side)
The right side of the window consists of six standard tabs:
-
Data
-
History
-
Other departments
-
Information
-
Attachments
-
Personal Notes
You also have the option to view linked tasks in Do boards and results from Forms checklists associated with the object.
Data tab
The information displayed under the “data” tab is based on the analysis view.
The purpose of this tab is to provide information related to the current node being followed up in the left section, giving you the necessary context to carry out your follow-up.
Navigate Using the Red Thread
By clicking on the name of the node you're following up on, you can view the red thread—i.e., how that object is connected to other goals, strategies, activities, etc., within the goal chain.
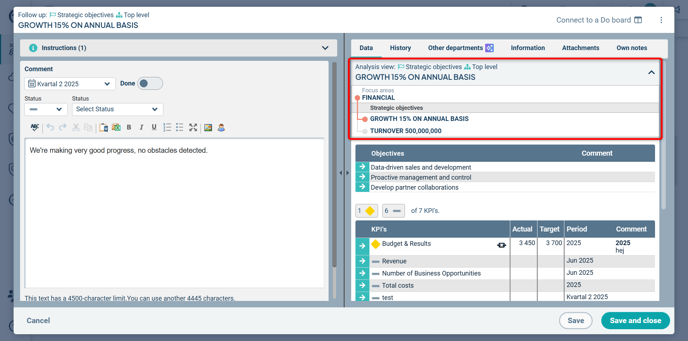
The information in the red thread is also clickable, allowing you to navigate upward or downward within the current follow-up chain.
Option to Explore the data Further
In the data, you can explore the displayed information in more detail using the turquoise arrows.
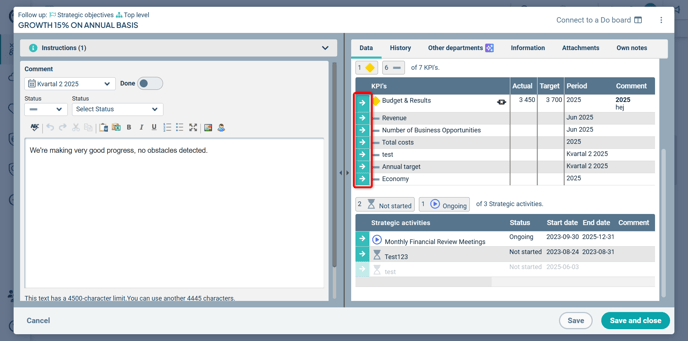
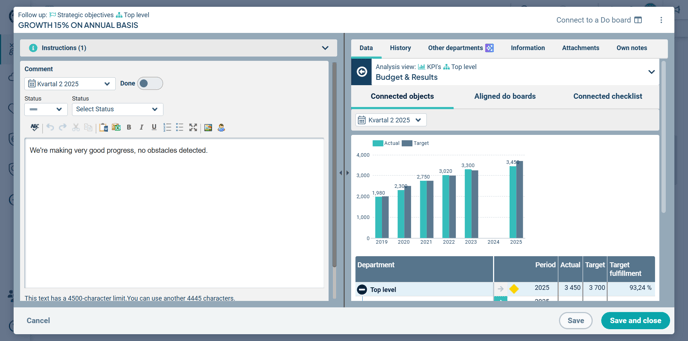
After clicking, the information linked to the object you selected will be displayed. In the example below, we have navigated into a sub-goal, which in turn has a linked metric. If there had been linked activities, these would also have been shown.
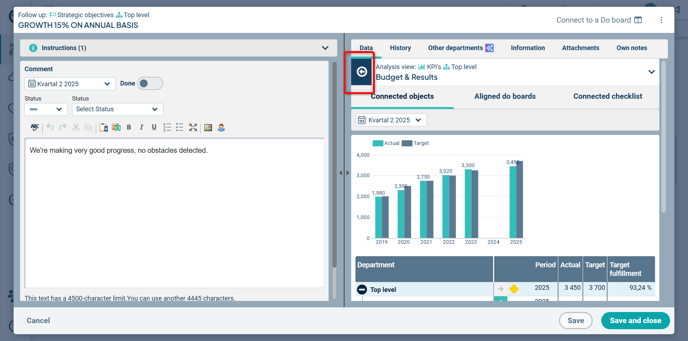
You can navigate back up the chain using the blue back button.
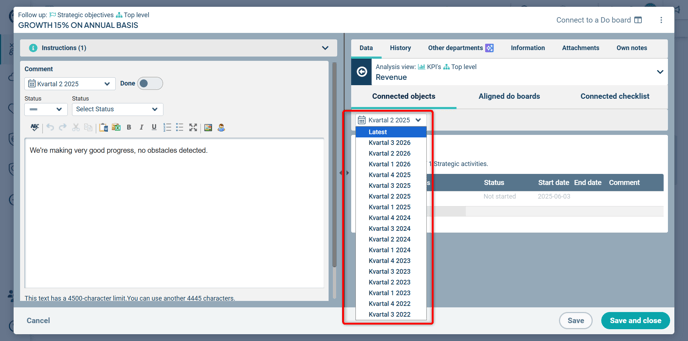
Option to Select the Period in the data
All users can filter which period the data should display information for.
Editing the data
Currently, the data cannot be edited directly within the follow-up window.
A global administrator can configure what should be displayed in the data via the three-dot menu in the follow-up window (context menu) by selecting “Configure data.”
Learn more about how to do this here: Analysis View.
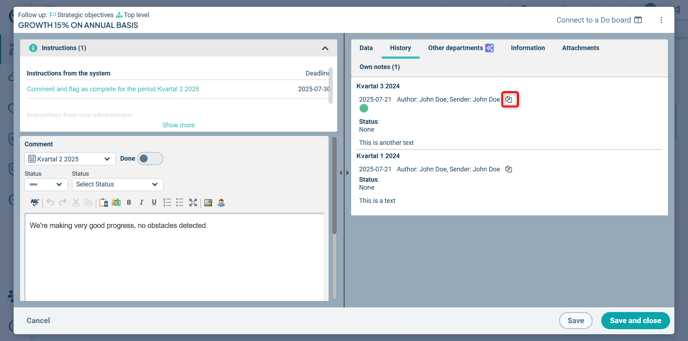
History
Under the History tab, you can view comments from previous periods. This tab is linked to the left side of the window—i.e., the history displayed corresponds to what you are currently following up on.
The comments shown here are those written at your organizational level for the current node in earlier periods.
By clicking the double-paper icon, you can copy a historical comment into the comment field for the period you are currently expected to follow up on.
Underlying departments
In the Other departments tab, you can see how departments at other levels have commented on the same goal, measure, or activity. The departments you can view may depend on your permission level.
Select which departments you want to see data for, and copy comments from other departments into the comment field for your own department. This is a valuable aid if you're working at an aggregating level and your follow-up depends on what has been written at underlying levels.

Summarize with Stratsys AI
If your organization uses Stratsys AI and it is enabled for this product, you can generate an AI-powered summary from all underlying departments. You can copy this summary and then further edit it as needed. If you see the AI icon (a star symbol) to the right of the tab name, the feature is available to you.

If you're not satisfied with the suggestion, you can regenerate it. Of course, you always decide which parts to include in your own comment—the text is only a suggestion.

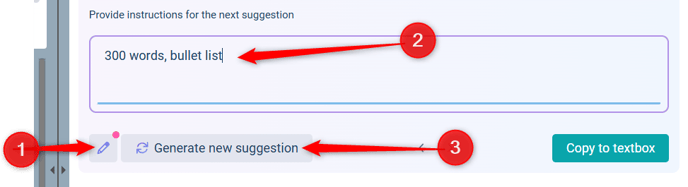
You can choose to give instructions on how the summary of the underlying departments’ text sections should be created by clicking the pencil icon (1) and entering your instructions (2). To generate a new suggestion based on these instructions, click “Generate New Summary” (3).
Information
Under the Information tab, you can view details entered during the planning phase or added/adjusted in the current object. Information displayed here includes, for example, various text fields, the responsible person, or any associated keywords.
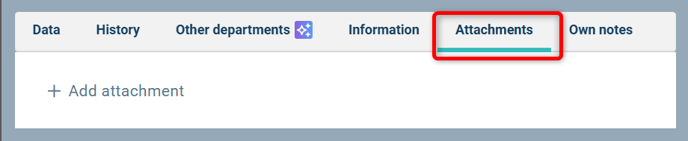
Attachments
Under the Attachments tab, you can view any linked documents or URLs. These are clickable and will either open in a new tab or be downloaded in your browser.
If you have the appropriate permissions, you can add new links and documents here or remove existing ones.
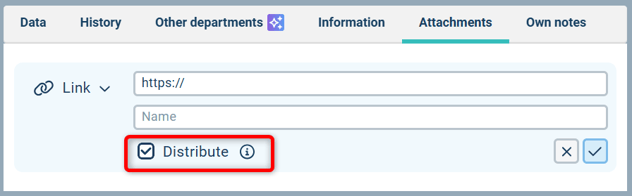
When adding a file or document, you can choose whether underlying departments should have access to it using the “Distribute” property.
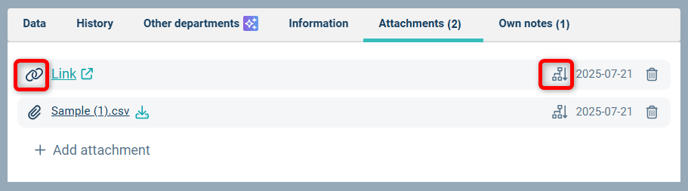
Using the icons for each attachment, you can see whether it is a file (paperclip icon) or a link (chain icon), and whether the attachment has been made visible to underlying departments—this is indicated by a distribution icon on the right:
If the options to add or remove are greyed out, you either lack the necessary permissions, or it is only possible to add from the top level of the node for this specific node type. In that case, you can go to the top-level node and make changes there, if you have permission.
See also:
Why Can’t I Add Documents and Links?
Personal Notes
Under the Personal Notes tab, you can add notes for your own use or content you believe all users should have access to.
The purpose of this feature is to allow you to prepare and draft your comments, or jot down things you want to remember, without necessarily including the text in reports or similar outputs.
Observe that a user with administrator permissions may be able to view what you write in the system, including in Personal Notes. Therefore, do not write anything you wouldn’t be comfortable sharing with other users.
Personal Notes Support:
-
Unlimited number of notes
-
Sorted by creation date, with the most recent at the top
-
Notes can be copied into the left-hand section of the window as a comment. This will not overwrite the existing comment; the note is appended to the comment field
-
You can also edit an existing note or delete it entirely
-
Numbers in parentheses indicate the presence and count of notes
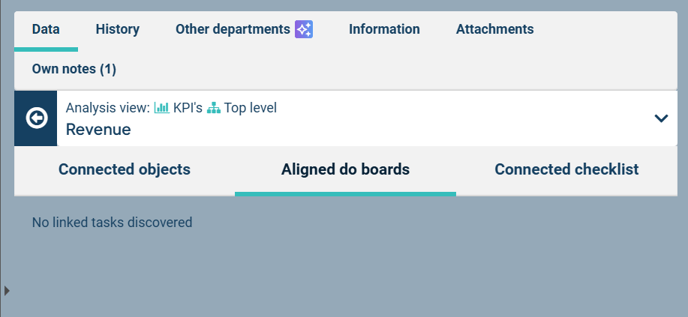
Tabs for Linked Objects
Tabs for linked objects are found under the data section.
In the “Linked Tasks” tab, you can see which Do boards are connected and the status of tasks linked to the object. You can go directly to the Do board by clicking on it.
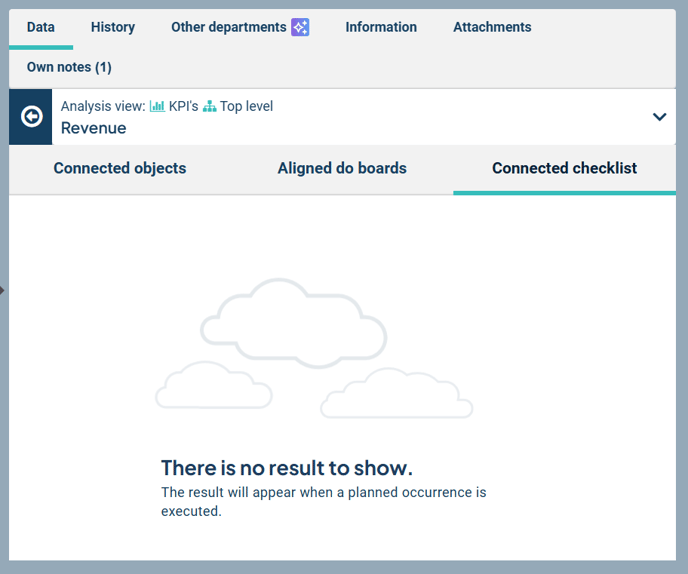
In the “Linked Checklist” tab, you’ll find the Forms checklists that are linked. By clicking on a checklist, you can immediately view its results.
Additional Features in the Follow-up Window
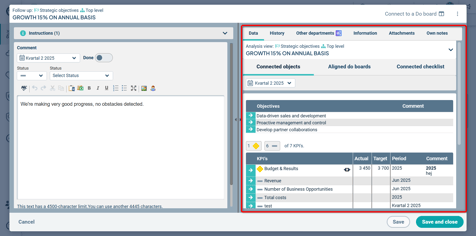
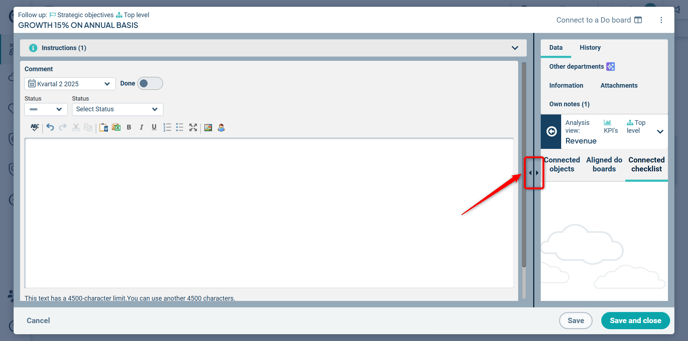
Adjustable Size of Left and Right Panels
In the follow-up window, you can adjust the size of the left and right panels. For example, you can allow the left panel to take up more space than the right. This is done by dragging the divider in the middle to the left or right. The adjustment resets each time you open the window.
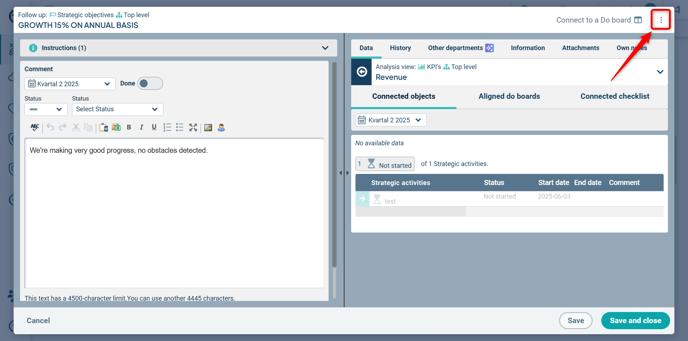
Access to the Edit Window
From the follow-up window, you can also access the edit window via the three-dot menu in the upper right corner (context menu).