![Stratsys-logo-deep-blue.png]](https://www.stratsys.com/hs-fs/hubfs/Stratsys%20Logos/Stratsys-logo-deep-blue.png?height=27&name=Stratsys-logo-deep-blue.png)
Description:
The new matrix has been developed to better support the analysis and prioritization of risk management, offering a clearer overview and simpler filtering. It supports work with gross and net values for risks.
Note! The development of the new matrix is ongoing. Therefore, information in this article will be continuously updated as new features are added and become available for more products.
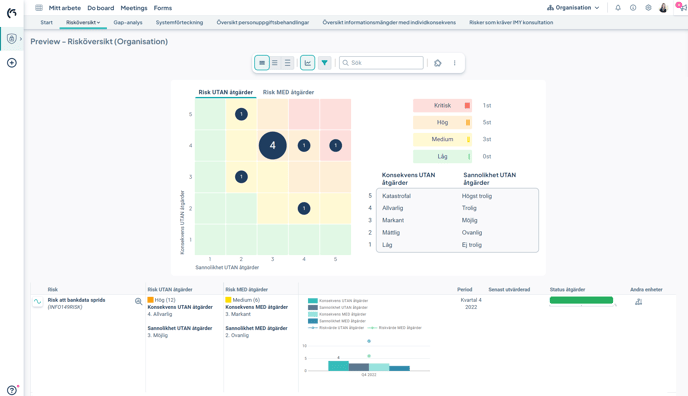
The new matrix with example risks:
Permission requirements and activation
- To gain access to the new matrix, you need access to the new view type. Currently, a product license for our standard product "Risk & Control" or "Information security" is required to access the new risk matrix. The new view is activated by us at Stratsys. For activation, or if you want to know more, contact your customer manager.
- To be able to use the new view and matrix, risk KPIs needs to be used. ||
Interactive Elements and Filters
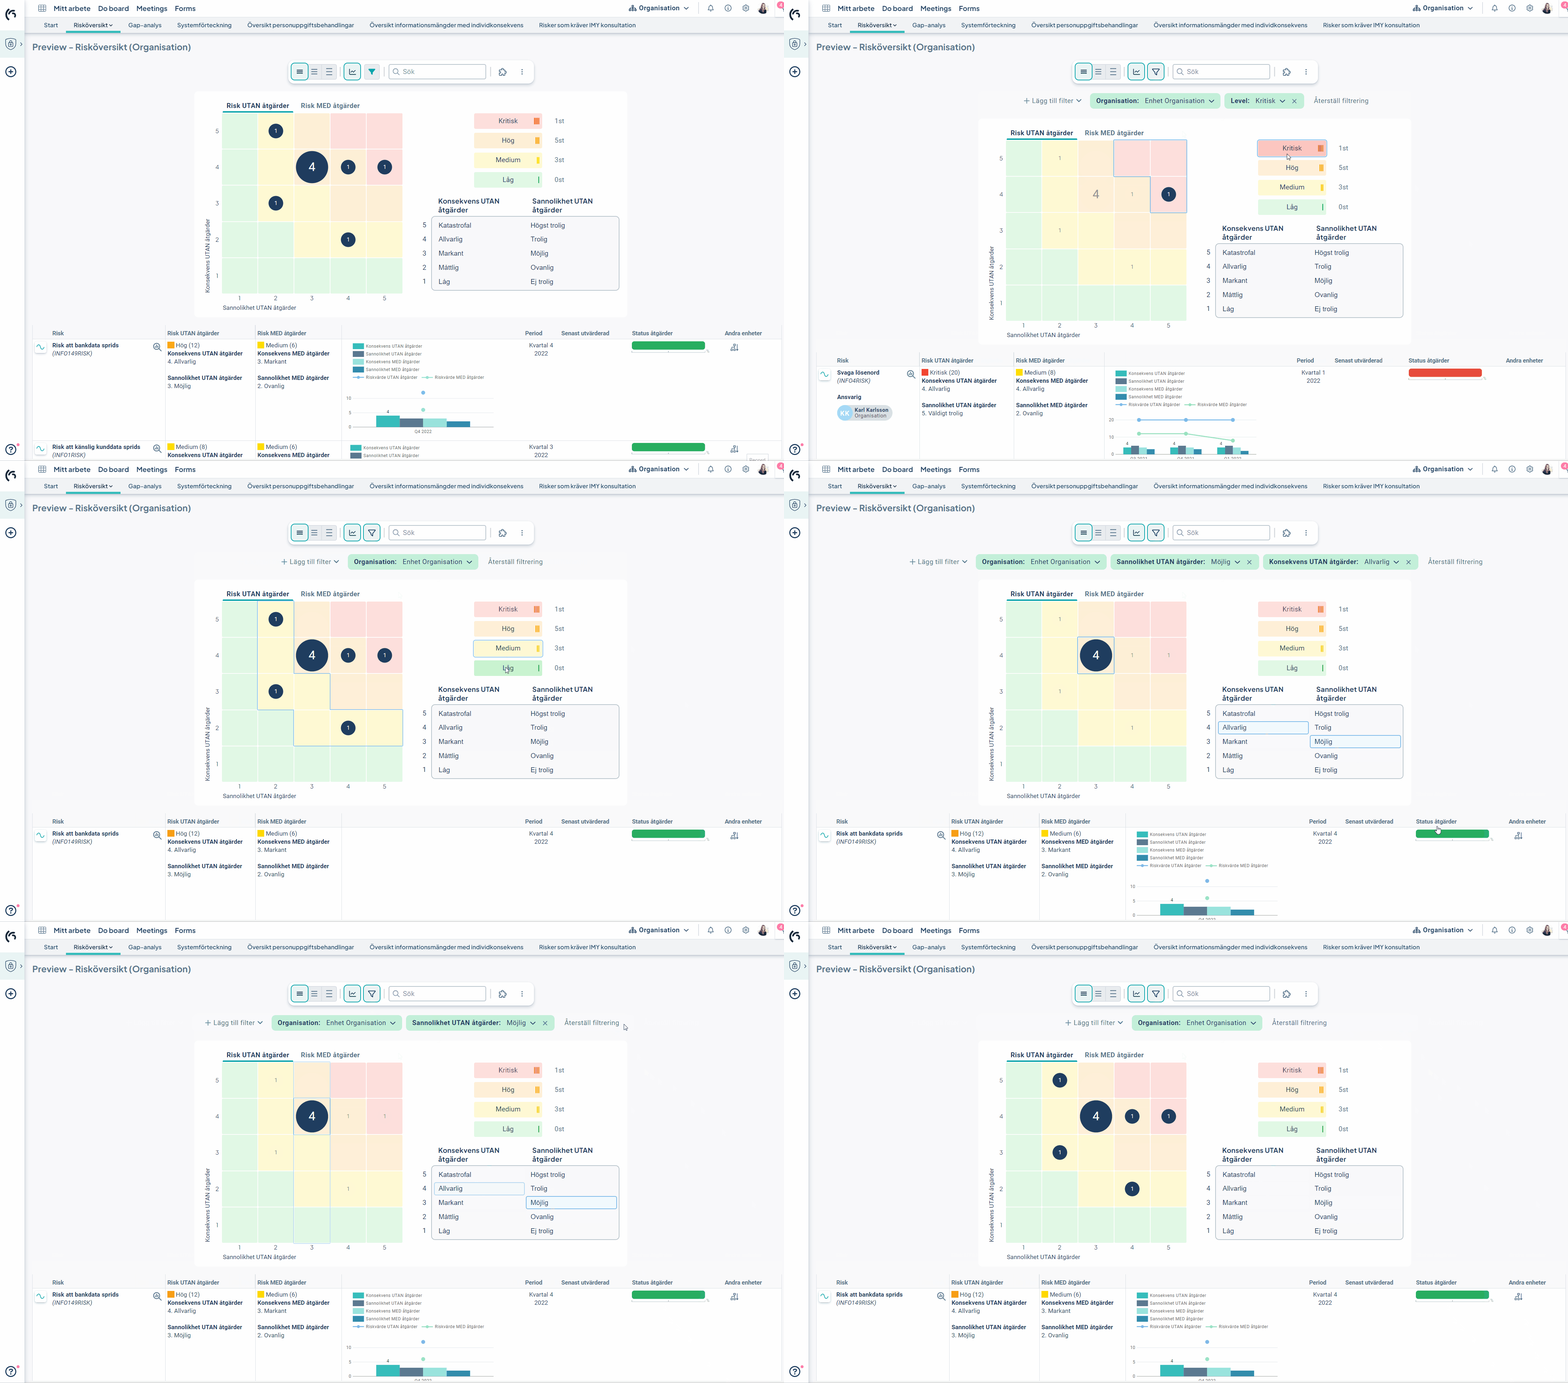
The risk matrix is interactive. By clicking on the different elements in the matrix, the underlying table is filtered. The matrix and the view use the same filters. In this way, it is clear and easy to follow how data in the entire view is filtered and changed.
The GIF below shows how different clickable elements interact with the filter:
Visual indication of the number of Risks
The total number of risks is shown for each cell with a number in a circle. The size of the circle corresponds to the number of risks in the cell, which facilitates an initial analysis of which risks may need to be addressed. For those working with gross and net values, this makes comparing gross and net values easier, as you can quickly see the change.
Hide or show the Matrix for increased focus in the moment
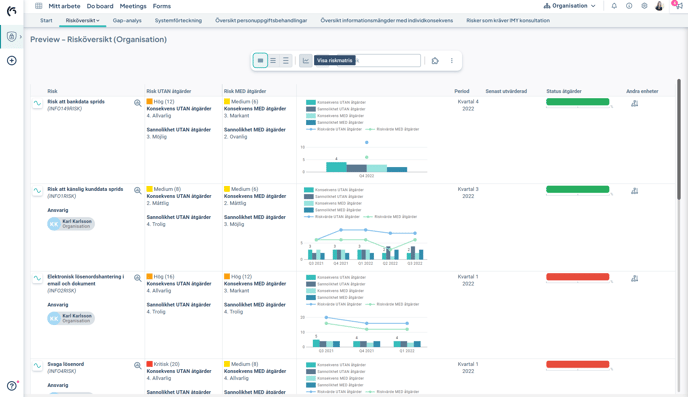
The matrix is displayed by default in the new view, but each user can choose whether to show or hide the matrix through the setting in the toolbar:

Work with gross and net values of Risks
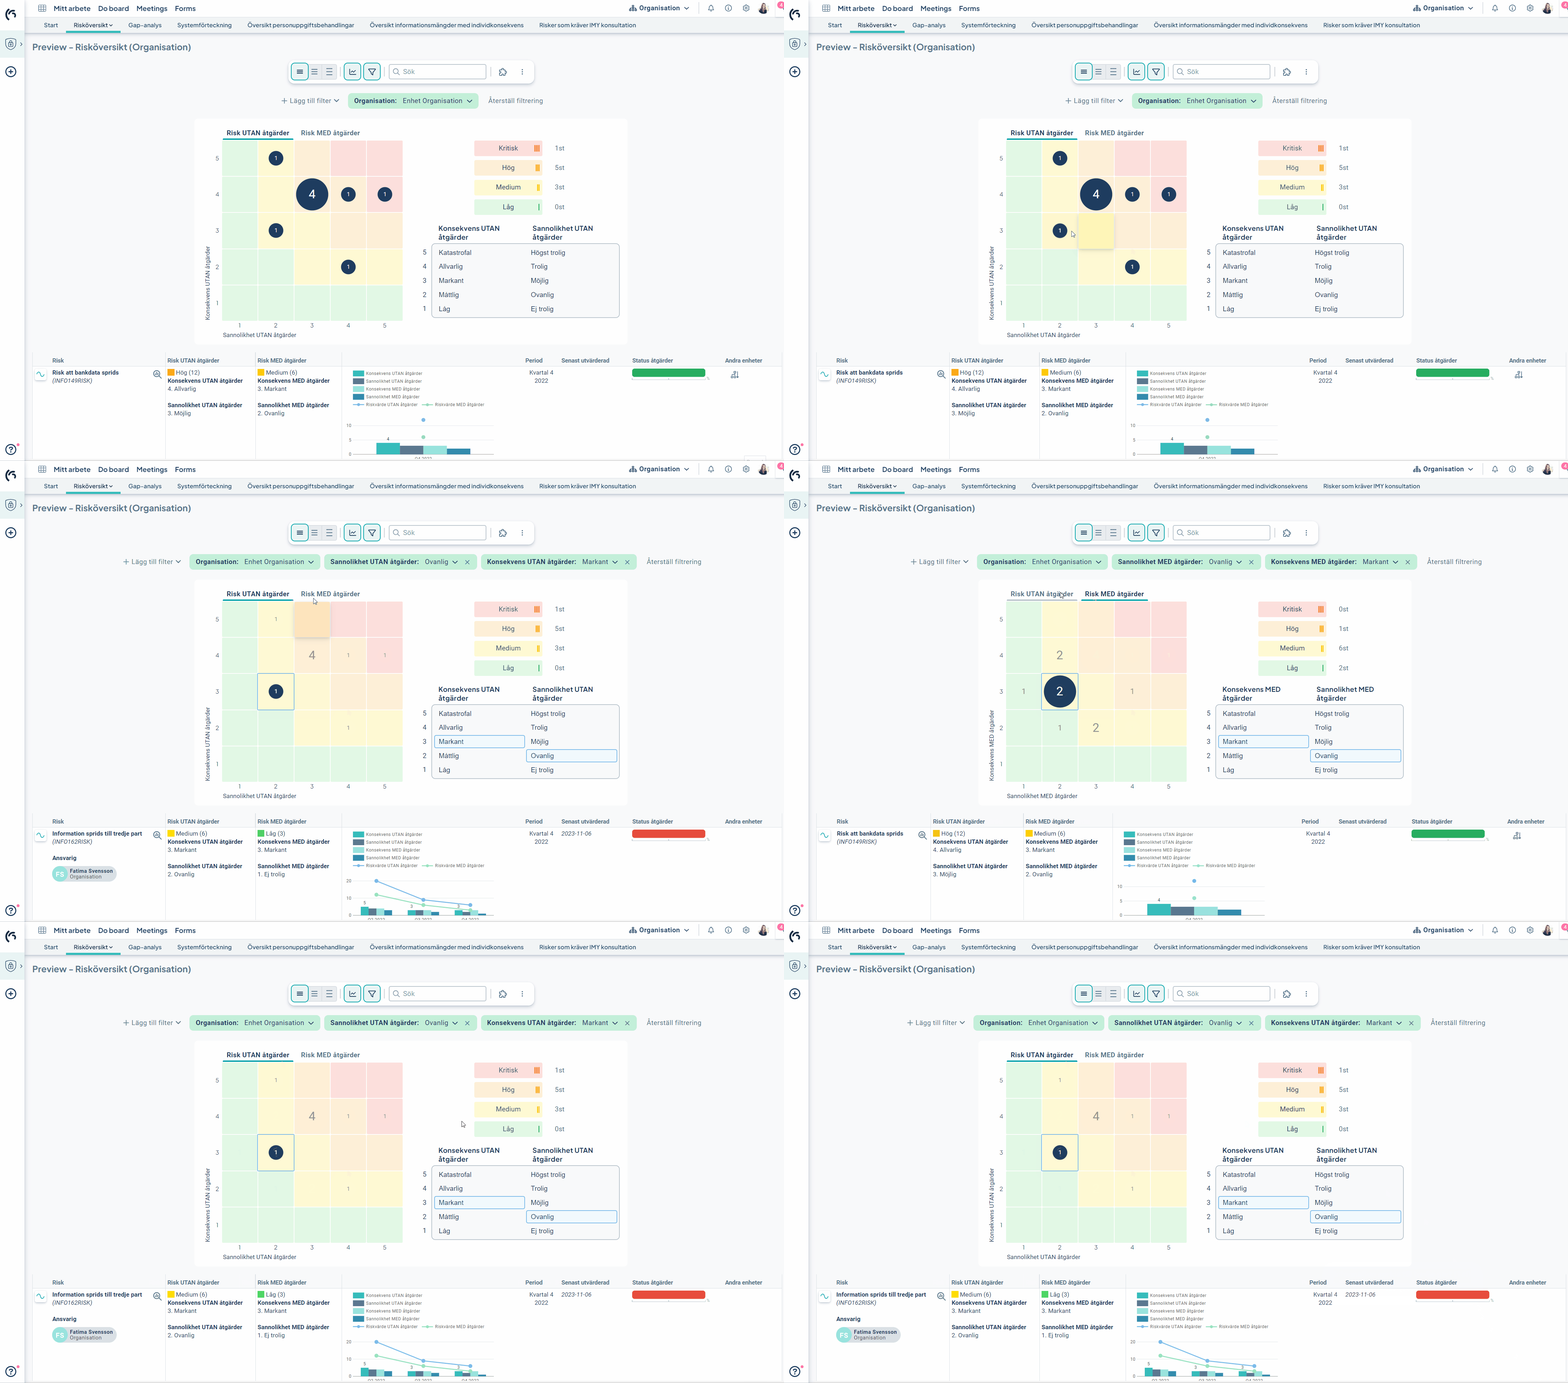
The risk matrix supports toggling between displaying risks without actions and risks with actions, also known as gross and net risks.
Note! When working with gross and net risks, the names for the different tabs in the view are derived from the matrix.
In connection with the activation of the new matrix, we therefore recommend changing the name of the matrices in the administration for the risk matrix from, for example, "Risk Matrix - Gross Risks" to simply "Gross Risks."
You can easily compare the distribution of gross and net risks by switching the display mode, as these are under separate tabs but still in the same view. The matrix remembers the last view the user was on.
When switching between gross and net values, the selected filtering is retained (provided that the matrices have the same configuration).
Activate the new matrix
The new matrix is activated in the administration for already created risk matrices:
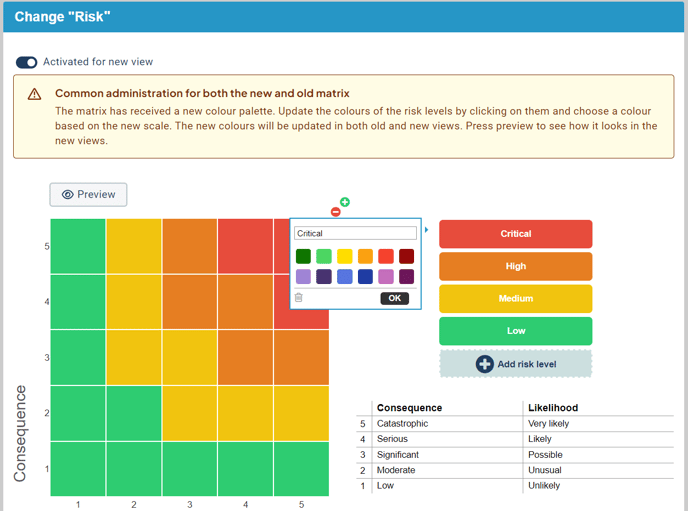
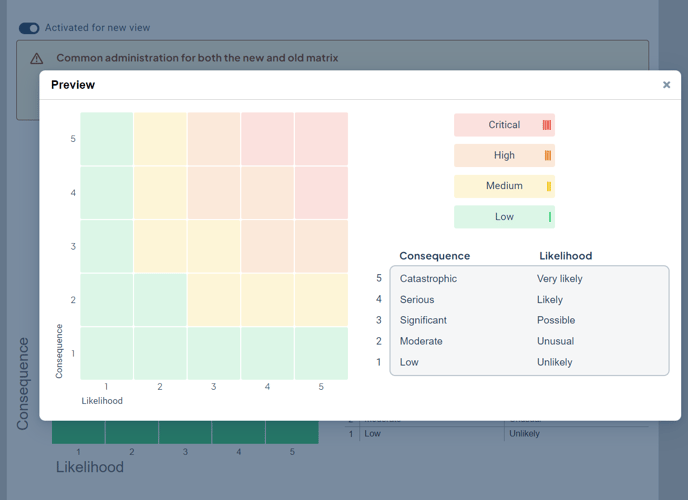
The appearance of the matrix in the view differs from the classic matrix, as the colors are displayed with a different opacity. When activating the new matrix, you can see a preview of how the colors will be presented in the view:
Observe! When activating the new matrix, the colors will need to be updated to a new color palette. This color update will affect the display of both the new and the old matrix.
The settings for the classic and the new matrix are common in terms of colors. To start using the new matrix, the matrix's colors need to be updated to new colors.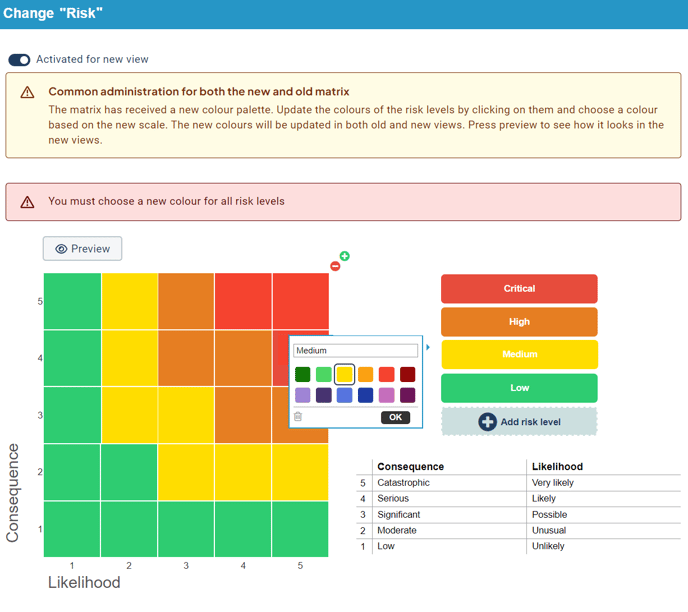
This is part of a larger effort to achieve more uniformity in the color palette of the platform, in order to ensure the right contrast and better meet accessibility requirements.
Limitations (as of 2023-11-21)
Not all features available in the old matrix are supported in the new matrix. Some of these limitations are permanent, while others are planned to be adjusted.
Here are the key limitations of the new matrix:
- The maximum size is 6x6 cells.
- The maximum number of risk levels is six.
- The new matrix contains new standard colors - you cannot choose your own colors.
- It is not possible to specify specific risk values for each matrix cell; the risk value is calculated automatically. To use the new matrix, the classic matrix needs to clear the values in the cell to be activated.
- The matrix only shows the total number of risks, not the individual risks numbered. If you want to number your risks with unique numbers, see Serial Number. ||
- The new matrix cannot yet be visualized in reports.