Overview
What is a Risk KPI?
Risk KPIs is a type of KPI node that provides increased support for risk management with gadgets for risks and stronger connection and support for the properties of the risk matrix.
Activation of risk KPIs
This feature is product specific, which means you need a product license to access the feature.
Summary
A risk KPI has a special section in the administration inside the "Standard KPI" under KPI settings:
Risk KPIs also have two predefined measurement columns per risk matrix connection with fixed calculation formulas.
You need to link your risk matrix template to the risk KPI type in order to use the gadget.
If you have not worked with risk management before, follow the steps here.
If you have an existing risk management, the existing risks need to be converted to Risk KPIs. through the function "Edit several KPIs" in the administration -
The conversion is done by applying a special Risk KPI template to selected KPIs / risks using the function "Edit several KPIs" in the administration. You can not update a single KPI to a Risk KPI, but must use the "Edit several KPIs" function. Follow these steps carefully, as data may be destroyed during conversion.
Steps for you who have NOT worked with risks matrices before
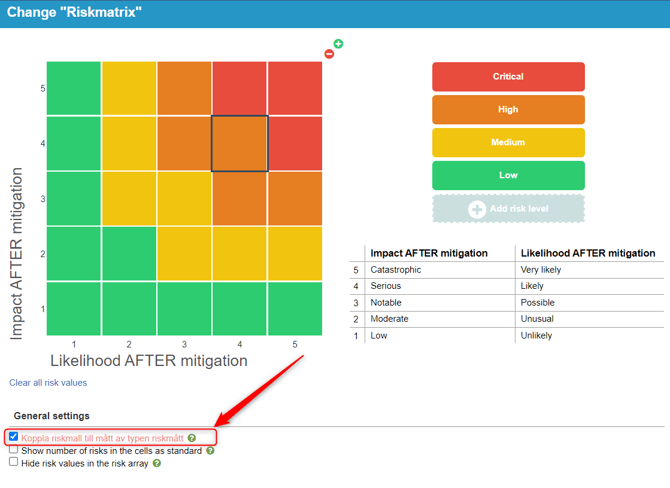
1. Create a Risk matrix.In the setting, you need to connect the risk matrix template to KPIs of the risk KPI type (see picture). The setting also means that KPIs that are not converted to risk KPIs will be hidden from the risk matrix.
This setting is currently only visible to Stratsys employees - contact your Stratsys consultant to activate it.
2. Create answer choices with the same name and values as in the risk matrix. See Measurement columns.
3. Create a Standard KPI for Risks. The standard KPI should have two measurement columns that have the same name as the axes in the risk matrix template (for example, "Impact" and "Likelihood") and use the same response options that you created in point 2.
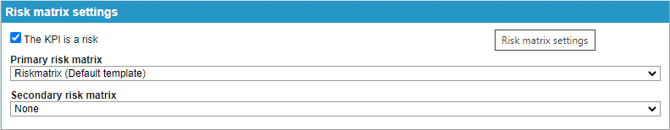
4. Check "The KPI is a risk" in the administartion section "Risk matrix settings" in the standard KPI and select which risk matrix or risks it should to be linked to.

5. Save the Standard KPI. Two new columns are now generated per risk matrix connection, one for Risk Value and one for Risk Level.
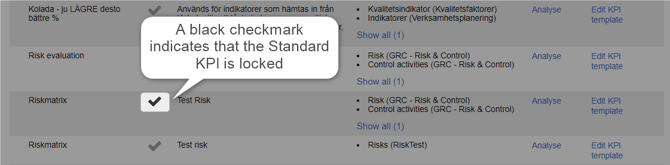
6.We also recommend that you lock the Standard KPI - this reduces the risk of data loss if you need to update your risk KPI at a later date.
7. Create a "Risk Matrix" type of view and configure with the properties you want to see node properties for risk KPIs.
Steps to convert existing risks to risk KPIs
ALWAYS test your conversion in a database copy first - For you who are Enterprise customers can do this yourself in a test database. For others, contact your Stratsys consultant.
1. Analyze existing KPIs that are currently used as risks
First find out which KPIs and associated Standard KPIs that needs to be updated so that all existing risks can be converted to risk KPIs.
To see which Standard KPI the existing risk KPIs are associated with, add the node property "Standard KPI" in a view that shows all risks:

All Standard KPIs used for risk KPIs needs to be updated - note these down to the next step.
Note: If there are risks with "unexpected" templates, it may be due to the following:
When a KPI is created, it gets a link to the Standard KPI that was used then. If the KPI has been changed manually, there may be a connection to a completely different Standard KPI than you think.
We recommend waiting with the conversion for KPIs with a "odd" Standard KPI - thus only change templates that are mainly used for risk KPIs.
Also wait with KPIs that are not connected to a Standard KPI.
Contact support for support in the event of deviations, for example through scripting.
2. Review and adjust of Standard KPIs
Review and adjust the Standard KPI already used for risks according to the analysis above.
Since the conversion creates new fixed columns for risk value and risk level, it can be good to delete existing manually created columns for this, as well as columns that are used for extra calculations of these. In this case, historical values disappear.
If you want to save all historical values - do the following:
- Give the columns new names so that it is indicated that they are old, e.g. "Historical risk value"
- Set column type to "Default" so that no reporting reminders are generated for users.
- Hide them (however, only calculation columns are hidden in the follow-up window, for example, so it is important that the names are clear).
Check that the risk template has measurement columns that have the same name as the axes in the risk matrix (s) to which you want to link the risk measures (eg "Impact AFTER mitigation" and "Likelihood AFTER mitigation").
Then tick "KPI is a risk" and select which risk matrix or matrices the risk KPI should belong to. Save the Standard KPI and open it again - you now see that the new risk value and risk level columns have been created.
To save time, you can now rename the new Risk Value and Risk Level columns to the same name as the old columns had - this way you do not have to replace existing node properties in views and reports.
We also recommend that you lock the Standard KPI - this reduces the risk of data loss if you need to update your risk measurements at a later time.

3. Activate the coupling in the risk matrix templates
Go to the settings for the current risk matrix templates and switch on "Link risk template to KPI of the type of risk KPI". The setting also means that risks that are not converted to risk KPIs will be hidden from risk matrices.
This setting is currently only visible to Stratsys employees - contact your Stratsys consultant to activate it.

4. Convert the KPIs to risk KPIs
For the KPIs to become risk KPIs, use the function "Edit several KPIs" in the administration - this is the only way to convert the KPIs.
Since quite a lot changes (and therefore can go wrong), we recommend that you first do an analysis of what will happen - above all, we want to prevent data loss!
Analysis:
Stand on the top department of the organization tree and make sure you are in the current version (Consolidated measurements are only updated if you are on the organization's top department when the function is used, regardless of which department the KPIs were created on. If the KPIs are not consolidated, it can be performed from another department).
Go to "Edit several KPIs" in the administration.
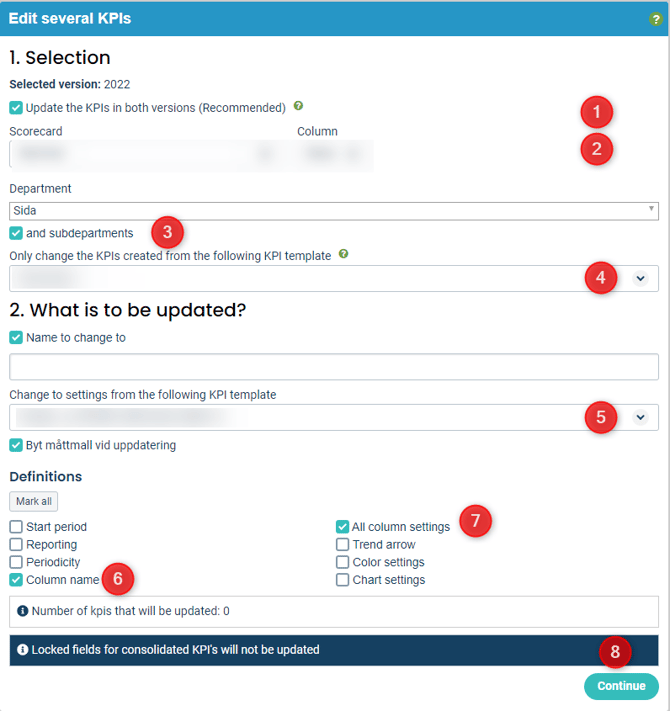
- Check that you want to update the KPIs in both versions
- Choose which scorecard that you want to update
- Check that you also want to update the KPIs of the underlying departments
- Choose that you want to change KPIs that are created from the KPI template (Standard KPI) from which the risks were created according to notes from previous steps - you can only change for one Standard KPI at a time, so repeat the process if you have several Standard KPIs.
- Select the Standard KPI that you want to change settings to - in most cases the same Standard KPI as in the step before, which is now updated to the Risk KPI template (Standard KPI).
- Check which definitions you want to be updated from the KPI template (Standard KPI). If you have only redesigned the template so that it counts as a risk KPI, you only need to tick "Column name" and"All column settings"
- Continue
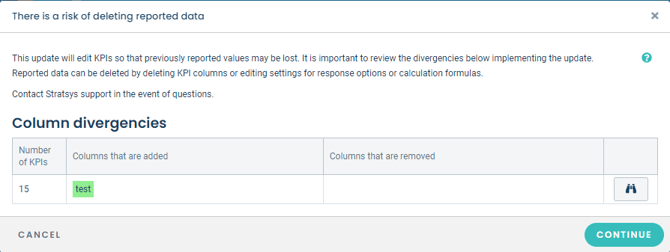
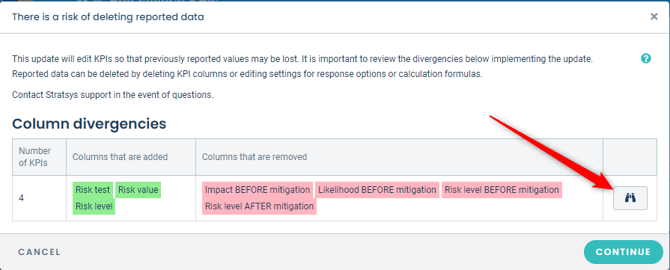
If the analysis result looks as in the image below, there is no risk of reported data being destroyed:
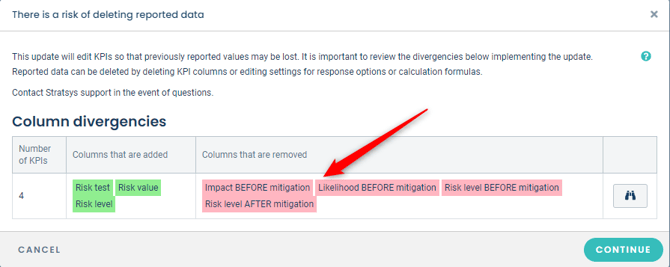
However, if it is listed that columns will be deleted and / or if there are points under "Other deviations" according to the pictures below, continue the analysis according to these steps: Extended analysis
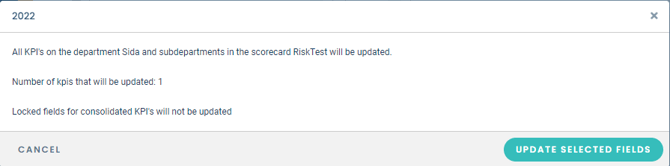
When you are satisfied with the analysis, continue and click on "Update selected fields":
Do you go directly to this box with "Update selected fields" without seeing any analysis before? Then check:
- Have you changed the KPI template (Standard KPI) to "The KPI is a risk"?
- Did you choose to update "Column Name" and "All Column Settings"?
The KPIs are now of the risk KPI type in your database copy - congratulations!
Check that views and reports look correct - update node properties if necessary - see Node Properties for Risk KPIs
Repeat for all KPI templates (Standard KPIs) that should be updated.
5. Change it in your current database
Make sure everything looks good in the copy before converting in the customer's current database. Feel free to give an experienced administrator access to your testdatabase to verify this.
Then convert in a sharp database - feel free to make another copy before the conversion if something has still been missed - it can then be used as a reference for later troubleshooting.
Risk value
The auto-created column Risk Level uses a fixed calculation formula also called Risk Level. It is not possible to change the calculation formula or set a consolidation formula for risk value columns. Risk level columns are automatically hidden when reporting.
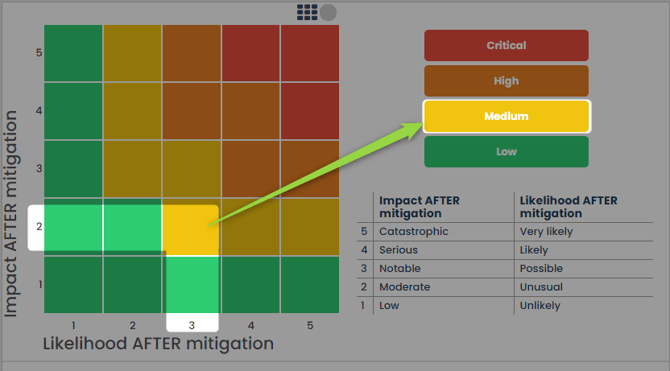
The formula derives the risk level from the linked risk matrix based on the values reported in the columns for consistency and probability.
In the example below, the risk level is Medium (yellow).
Node properties for Risk KPIs
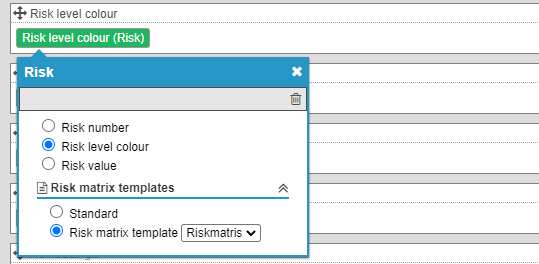
For risk KPIs, there are node properties that show risk number, risk value and risk level color. If you also want to display the name of the risk level, for example "Serious", select the node property for the measure column for risk level - note that you must first create at least one measure that has this column in order for it to be selectable as a node property.
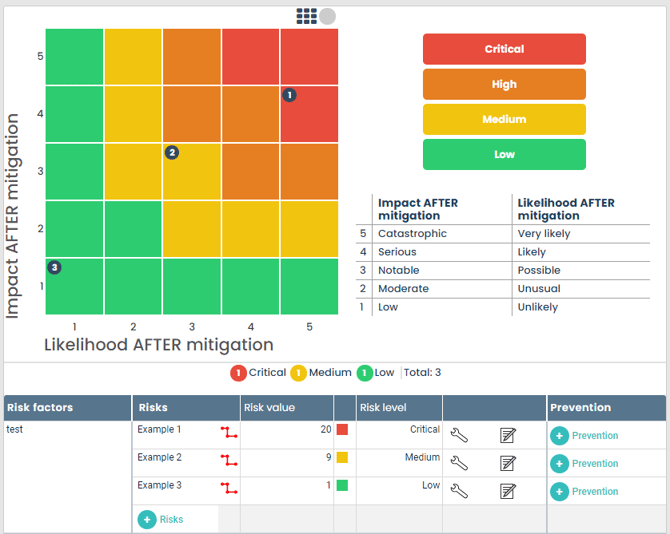
If you also want to display the name of the risk level, for example "Critical", select the node property for the measure column for risk level - note that you must first create at least one measure that has this column in order for it to be selectable as a node property.
Make sure you choose the right risk matrix template for the node properties:
Extended analysis
Column divergrencies
If there are measurement columns in the column "Columns that are deleted" (pink-red), affected dimensions need to be analyzed further to avoid data being deleted or misleading.
Columns listed will either be renamed or deleted. Columns are only deleted if the KPI template (Standard KPI) contains fewer columns than the measure being converted - in other cases a name change takes place, which means that existing reported data can be misleading.
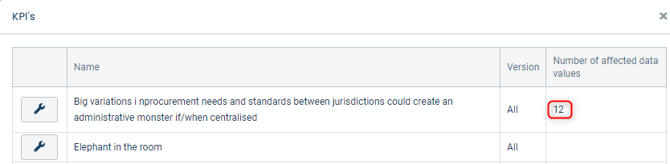
Click on the binoculars symbol and select which dimension you want to look at it.
Here you can see if there is dimensional data in the columns that will be renamed or deleted. Reporting done on any underlying departments is also included, but if you need to analyze reporting on underlying departments further, you need to do it from a view, preferably a consolidation view as the wrench icon opens the KPI at the top level.
If the number of listed rows does not match the number of KPIs, the missing nodes can be secret nodes.
If the KPI is only available in the planning version, you can only open it if the analysis is done when you are in the planning version.
Even if it says that the columns are deleted, it is not certain that reported data will actually be deleted (eg for older KPIs that have changed many times) - in some cases the columns will only get new names and existing data will then remain. Do the conversion in a test database first!
Other divergencies
Other divergencies are presented in a separate table and can concern calculation formulas and data type. For example, there is a KPI that is currently being reported with figures, but where possible. reported values will begin to be presented as response options if the change is implemented.
The binoculars makes it possible to analyze the KPI if you think the change can cause problems in the old risks. You can also see if a measurement columns that does not have a calculation formula before but that will get it for some KPIs after the update.