Risk matrix

Modify the risk matrice template

Risk matrice and views

Data columns to generate values for Risk matrice

Node properties for Risk matrices

The interactive Risk matrice can usefully be used as a good support in the management of internal control and SOSFS 2011:9 in Stratsys.
You can use Riskmatriser as Visningsläge In views but also highlight them in the desired report. In addition to the filtering settings that you can do directly in Risk matrice view, you can also Modfiera Risk matrice template In the administration, you will find this under the Settings section.
 
Risk values are set in the Risk matrice according to the scale:
1: 0-1
2: 1-2
3: 2-3
4: 3-4
5: 4-5

Obs! If you work with decimals at the assesments of risks, it is important to keep in mind that a risk with the value 3.2 is in the range 3-4 and will thus be placed in box 4.

Modify the risk matrice template
Here you can now make the desired changes to the risk matrix template.

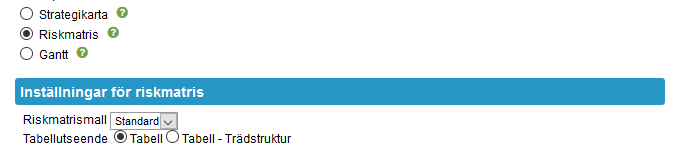
You can in the administration under Settings create Riskmatrismallar which you can then edit as needed via Change Risk matrice template.


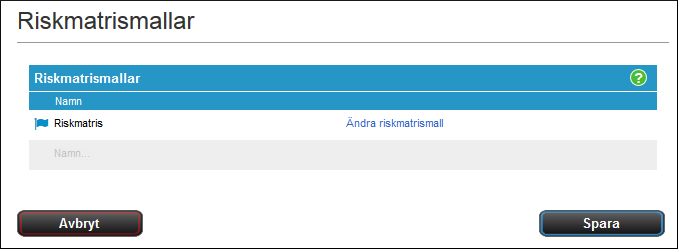
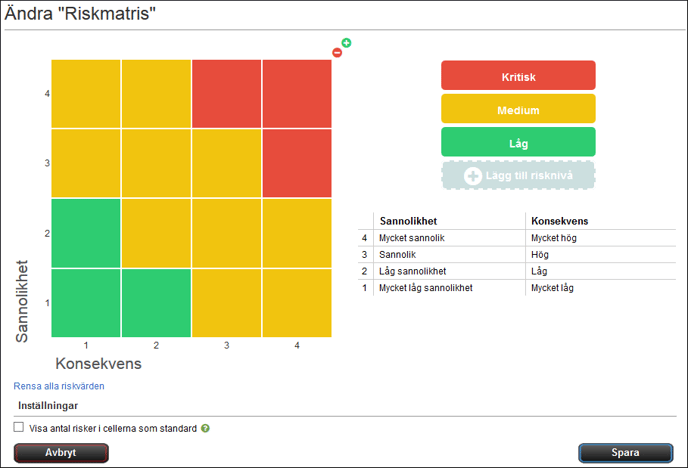
Add Risk Level -Add new risk levels, enter a name, and select a color.

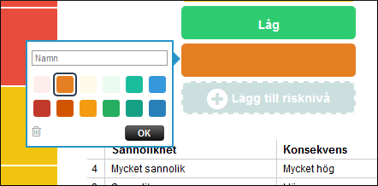
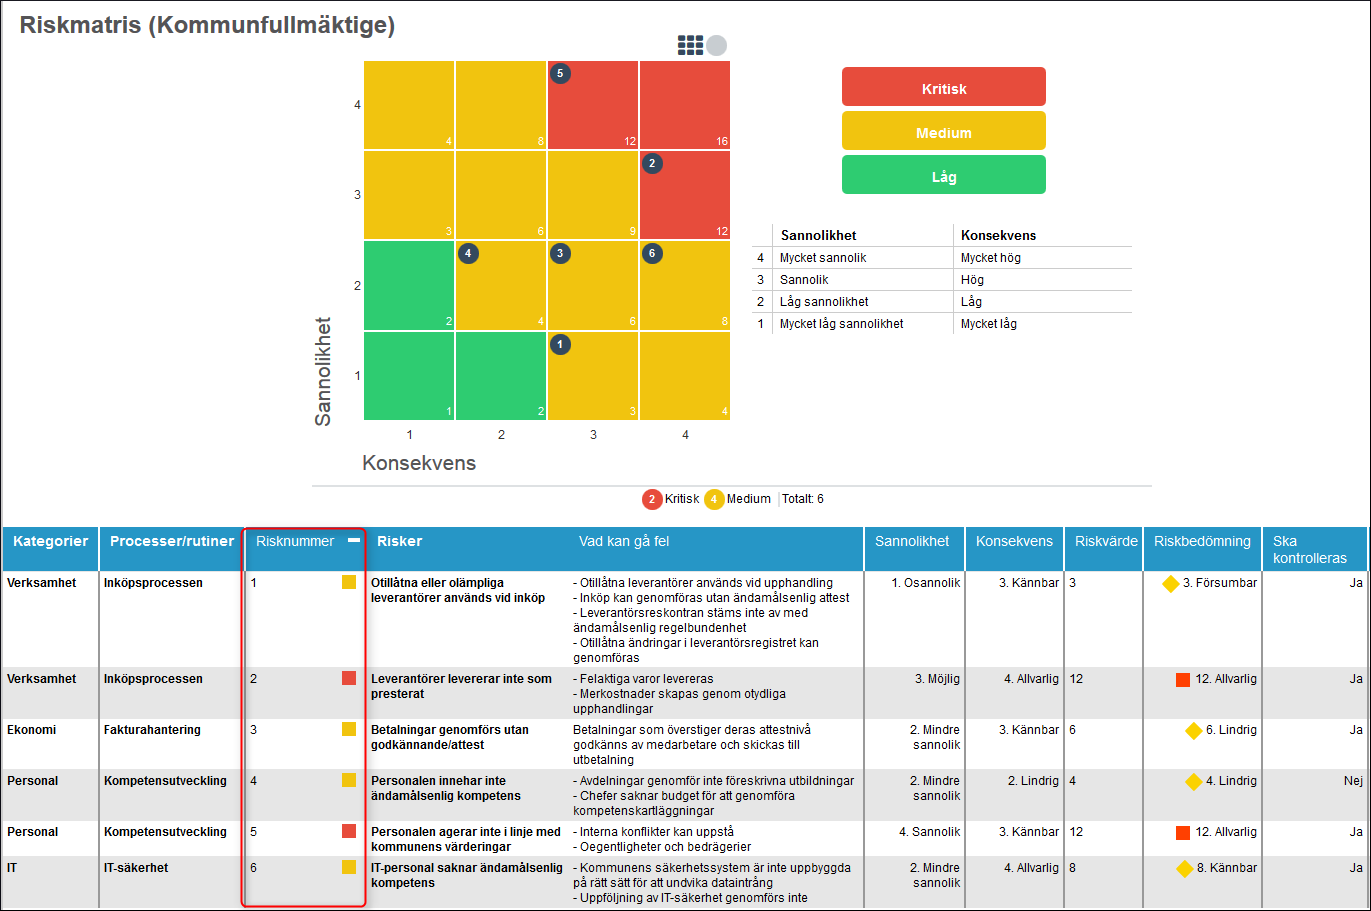
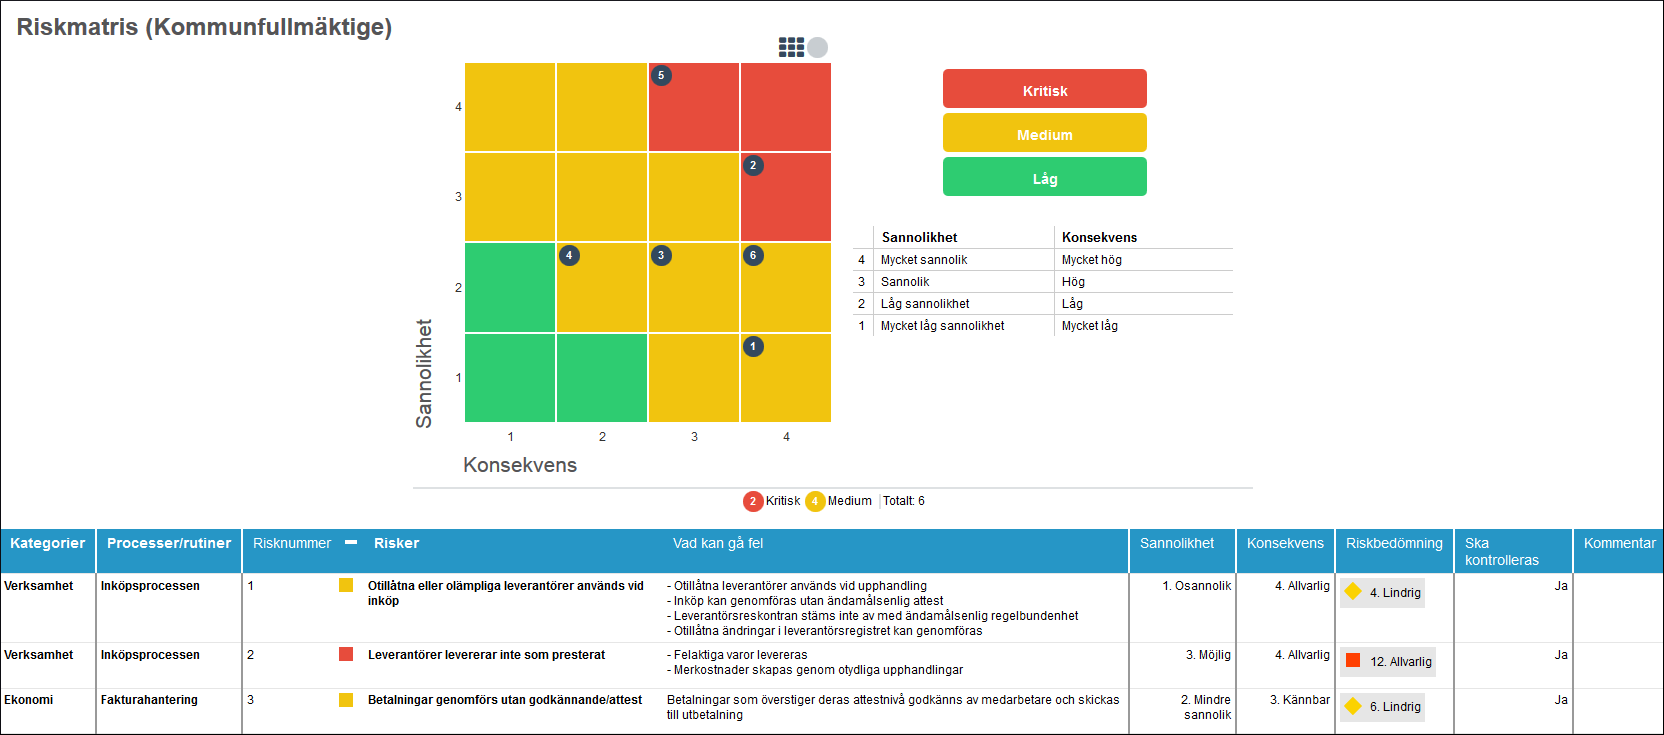
To expand/Decrease the Risk matrice, use the plus/minus signs in the top-right corner.

You can click a single cell in the Risk matrice to change its color, and enter a specific risk value.

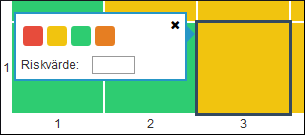
Clear all Risk values -Deletes all added risk values
Show the number of risks in the cells by default -If this option is selected, the sum of the number of risks will be displayed in each cell.

Risk matrice and views
Click the Gear wheel In the Black toolbar on the right side of the view to access the settings for the view. Next, click the Change button to access the view settings, and then scroll down to display mode.

To use the Risk matrice, select in the settings for the viewing mode of the Risk matrice.

Under Risk matrice Settings You can choose to Risk matrice template to be used via the drop down menu.

You can also select a Chart design:
1. Table -Displays the information under Risk matrice in tabular format with the same functionality as viewing mode table Which means that you can sort the data in the table by clicking on each header.

2. Table-Tree structure -Allows you to add information to the table so that you can added risks, actions and more.

You can click on the respective risk level color to sort out under Riskmatrisen the risks that have the same risk level. You can also click per row/column to filter out the risks in the Repspective row/column.
In the upper right corner of the Risk matrice, you can choose Show All Or View summary
After filtering, you can clear the filtretering by clicking Clear Selection

Create the data columns that generate values for the Risk matrice
To display values for, for example, The probability, consistency and risk value or what you wish to name the respective value to, you proceed in the following way.

Open the "risk" in the view via the wrench and go to the tab "Settings" Here you now click "+ Add Column". This will add a column of data which you name to the desired term for the value to be displayed, e.g. Risk value, probability, consistency.

How to set up a column of columns can be found here in Measurment columns.

You can use the Risk matrice in two ways:
1. You can view the risk values, that is, the sum of the value in the probability column and the consistency column.
2. Select to show probability and consistency without summation, the value is set per respective axis. If the probability is 3 and the consequence 1 indicates the risk in the first box of row three.

If you intend to use the view for most risks, we recommend that you create "Measurement columns"Where the desired data columns are included so that you don't have to create these separately per single node in the view.

Node properties for Risk matrice
There are two Node properties specifically designed to handle information related to Riskmatriser.

1. Risk number: To display the Risknumber i Risk matrice view add node properties Risknummer for the desired scorecard column in the view.


2. Risk color: To view the selected Risk color For the risk in the view, you can use Node properties Risk color For the desired scorecard column in the view.

In the view, the results appear as below, in this case, the Node porpeties above has been added to the scorecard column risks.