Here you, as a user, will find the information you need to be able to write in a report.
Table of contents
Toolbars
Reporting
Summarize underlying departments with AI
Report in Text Sections
Report in Table Sections
Report/Edit Information in Report Sections
Mark a section as Complete
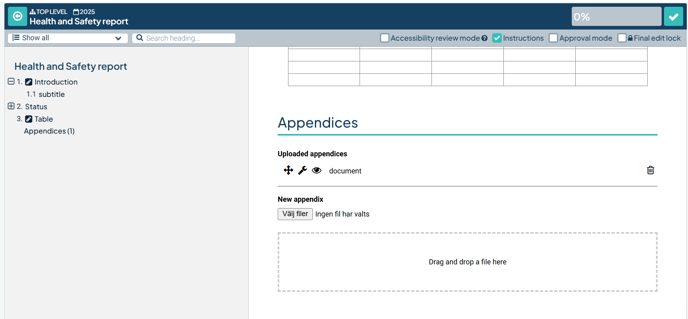
Appendices
Description
There are several ways to access and write in a report:
-
Via the To-do list under My work – the reports for which you are a reporter will appear as cards in the To-do list. By clicking Report on the card, you will be taken directly into the report.
-
Via the Reports page – here you will see a list of all reports available at the department you are positioned on. Click the Report link to begin reporting.
-
Via the menu bar – administrators can add reports as menu tabs in the menu. If this has been done, you can access the report directly through the menu.
Table of Contents
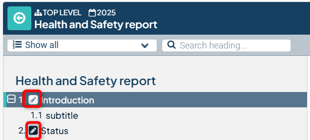
When you enter the report, you will see the full table of contents on the left side of the page. Under these headings are text sections and tables. All sections where you can write are marked with this icon:![]()
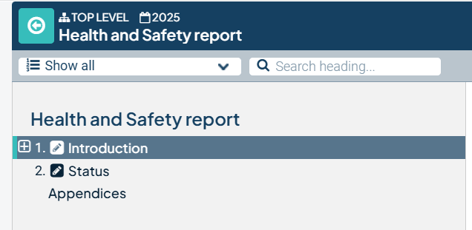
Click the plus/minus icons to expand/collapse the different sections in the table of contents.
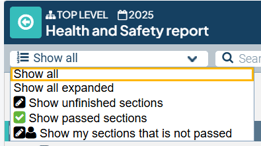
To facilitate reporting, there is a dropdown list above the content structure. This can help you locate sections that are not yet complete. You can also search for any heading using the search field.
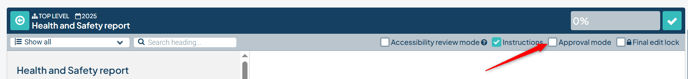
Toolbars
In the toolbars located above the report content and to the right, you will find several features that may assist you during reporting:
-
Accessibility review mode allows you to add alternative image captions to ensure the report's content is accessible to screen readers.
-
Instructions lets you show or hide the instructions written by your administrator.
-
Approval mode is a quick mode for marking multiple headings as complete at once. You can choose to mark all or individual headings. Read more about completion marking further down.
-
Final edit lock prevents others from editing the report.
-
Completion Bars are the orange and/or green bars that indicate how much of the report is completed or ready for approval, shown as a percentage.
-
Mark as Complete marks the entire report as completed.

Panel to the Right of the Report:
-
Preview – Displays a preview of the report in a new window.
-
PDF – Exports the report to PDF.
-
Word – Exports the report to Word. The arrow beneath the Word icon allows you to export the report with or without the table of contents. Choosing to export without the table of contents speeds up the export process.
-
Update – The update function refreshes all content in the report, including headings.

Reporting
Text and Tables
Headings that contain text sections and tables to be completed (and that are not marked as complete) are indicated with an icon showing a notepad and pen. Click on such a heading to start editing.
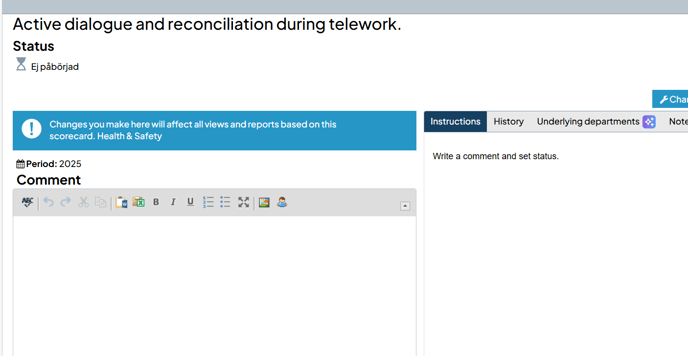
On the left, you will see a text box (or a table if it is a table section) where you can enter your text.

You cannot edit a section while another user is editing it. If the section is already open by another user, you won’t be able to click on the heading, and a warning box will appear with information about who has locked the section.
To the right of the text box, you'll find information designed to support your work:
Instructions
The purpose of the instructions is to assist you when entering text into a report. There may be both general instructions for the heading as well as targeted instructions for each text section or table under that heading. These targeted instructions are located to the right of the respective text section or table.
History
In the tab to the right of the instructions, you can view the report’s history. Here, you can read what was written in a previous reporting period. You can then choose to copy the historical text into the text box and make any necessary adjustments.
Underlying departments
If the report is written at multiple levels in the organization, this section shows what has been written by subordinate departments. Different reports may have different settings for when this information becomes readable—for example, only after the section has been marked as complete by the subordinate department.
Summarize underlying departments with AI
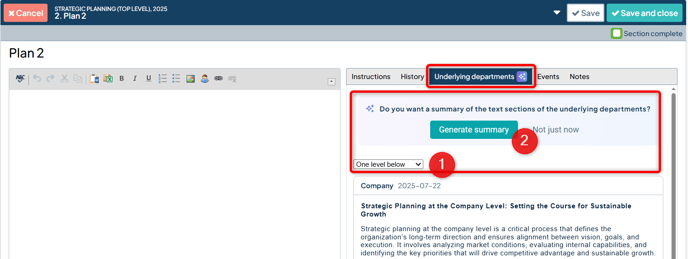
If Stratsys AI is enabled for the report, you can receive an auto-generated summary proposal based on selected subordinate levels.
You can tell the feature is available by the star icon to the right of the "Underlying departments"-heading. Select how many underlying departments you want to summarize (1), then click Generate summary (2).
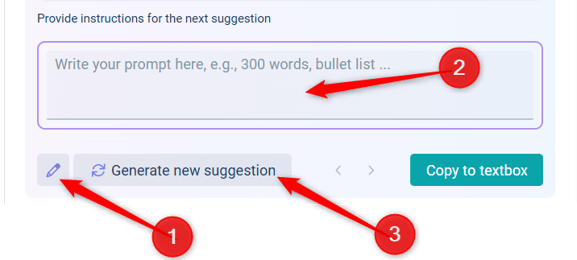
If you are satisfied with the suggestion, click "Copy to text box" (1). The comment will then be placed in your comment field, where you can continue formatting and editing the text as desired.
If you are not satisfied, you can generate a new suggestion (2) by clicking "Generate new summary." If you want a longer or shorter suggestion, click the "text" icon on the right, then select "Longer" or "Shorter" from the menu (3). Once you have generated multiple suggestions, you can navigate between them using the arrow icons (4).
You can choose to provide instructions for how the summary of the comments should be generated by clicking the pencil icon (1) and entering your instructions (2). To generate a new suggestion based on these instructions, click "Generate new summary" (3).
Under Events, any changes made to the text are logged, making it easy to trace modifications. You can see which user made the change, when it was made, as well as what the content looked like before and after the change.
Notes
Here, you can write notes about the section that only you can see. The note will not appear in any report or printout. You also have the option to make the note visible to others, in which case it will be visible to other users who have permission to edit the section. These users can then also respond to your note.
Observe that a user with administrative permissions may be able to view what you write in personal notes. Therefore, do not write anything you are not comfortable sharing with other users.
Enter your text in the text box (see image below). You can also paste text from another document. Formatting is limited to ensure consistency in the appearance of reports—only one font, size, and color set is used.
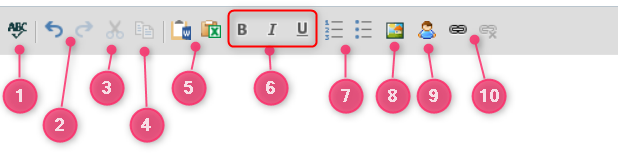
When pasting text from another document, all formatting is reset. The only formatting options available are those provided by the buttons above the text box. Here is an explanation of the text section toolbar:
-
Spell check all text
-
Undo and redo changes
-
Cut (Ctrl + X)
-
Copy (Ctrl + C) – paste with (Ctrl + V)
-
Paste from Word / Excel
-
Bold (B), Italic (I), and Underline (U)
-
Numbered list and bullet list
-
Insert image
-
View authorship of text entries
-
Add and remove links in the text field
Spell Check
Click the ABC button to activate the spell check in Stratsys. When activated, misspelled words will be highlighted in red. Clicking on the word will bring up spelling suggestions for possible corrections.
Pasting Tables or Text
You cannot paste tables and text sections at the same time. If you paste a large section that includes both, the tables will be removed and only the text will be pasted if you choose to paste from Word. The opposite applies if you paste a table from Excel.
Tables can be pasted from both Excel and Word. Use the Word and Excel icons in the text field toolbar to do this.
When pasting, graphical formatting such as background colors, text colors, positioning, indents, borders, and images inside tables is removed. Cell formatting—such as currency, percentage, and date—is retained, as are horizontally merged cells.
If a table is pasted, you will be taken directly to a dialog box where you can adjust its appearance and format. If it is text, you format it directly in the text section.
Edit Pasted Table
Double-click the table to enter edit mode.
You can add or delete rows even in pasted tables.
Insert Image
You can choose to insert an image file or paste an item copied from an Office program as an image. Images cannot be further edited in Stratsys. Keep in mind that the image size must fit within the Word template!
- Click Insert Image.
- A window will open where you can insert your image. You can do this by choosing between two options:
Option 1 – Upload an image file from your computer.
Select an image in the correct file format using your file explorer. The image must be in jpg, gif, or png format and must not exceed 10 MB. If the image is larger than the comment field's editing area, it will be scaled down to fit. If you want the image smaller than the original, it's best to reduce the file size in an image editing program before pasting.
Option 2 – Paste an image you’ve copied (Ctrl + C) by pressing Ctrl + V.
Depending on whether your web browser is up to date, the paste window may look different.
Note: Be careful not to copy areas that are larger than what fits within the margins of a standard A4 page. If you do, there is a risk that the image will be reduced to a size where the content becomes unreadable.
If you're using Excel and want to see how much area fits on an A4 page, you can switch to Layout view, which you can find in the status bar at the bottom of the program window.
Move and Delete Image
Drag and drop the image to place it where you want it to appear. Excel tables pasted from the clipboard are also saved as images. To delete an image, click on it and then press the Delete key.
Who Wrote What?
When reporting text in nodes and reports in Stratsys, you can see which user wrote which part of the text. This is a useful feature when multiple users are working on the same content.
When you click the icon, each user’s text is highlighted in a different color, allowing you to see who wrote what. You can also see the name of the user who wrote a section by hovering over the text.
Clickable Links in Reports
Using the link icon in the text editor, you can insert links both in instructions and in reporting, tied to the text sections of the report. The links support both http and https and are clickable in the tool as well as in Word and PDF exports.
Character Limit
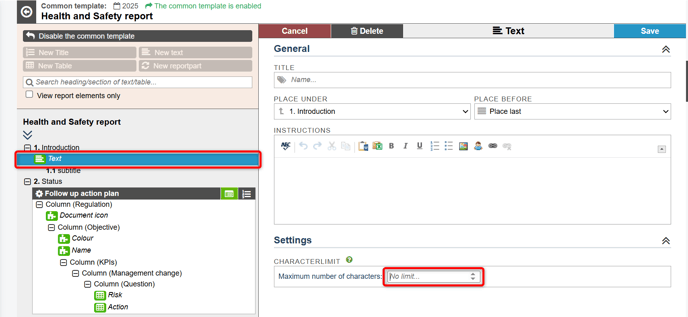
If a character limit is set for the section you're editing, a live countdown of the remaining characters will be displayed at the bottom of the text box. The character limit must not be exceeded in order to save. For report sections, the effective limit is the higher value between the column character limit in the scorecard and the general comment character limit.
For manually added text sections, you can set the character limit for each selected text section in the common template of the report, as shown in the image below.
Report in Table Sections
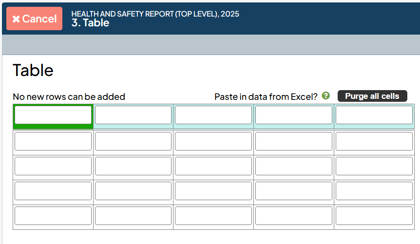
In the cells that are empty, you can enter numbers or text, depending on what is required.
If the template administrator has set a formula in a cell, you will not be able to enter anything in that cell. The value is calculated automatically when you save or click the Update now button.
Note: Avoid using spaces as thousands separators. The system will automatically add thousands separators after you have saved the section.
Tip: If you're pasting table data from Word or Excel, you don't need to cut and paste one cell at a time. You can cut multiple cells at once, then place the cursor in the top-left cell of the table where you want to paste the data. The cells you copied will automatically be inserted into the corresponding cells in the system’s table.
Add New Rows
If the template administrator has allowed additional rows to be added to the table, you will see an indication above the table showing how many rows may be added. To add a new row, click the plus sign to the right of the table. Plus signs are displayed next to each row in the table so you can choose exactly where to insert a new row.
If you want to delete a row that you added yourself, click the minus sign to the right of the table.
Add Footnote and Supplementary Text
If the template administrator has allowed footnotes or supplementary text to be added below the table, you can do so by clicking Add footnote or Add supplementary text, which you'll find beneath the table.
The text entered in the footnote will appear directly under the table in italic style.
Report/Edit Information in Report Sections
Some sections in the report are known as report sections, meaning that their content is automatically retrieved from other parts of Stratsys. For example, if you have entered your follow-up on activities and measures with statuses and comments, that information will automatically be pulled into the report. The goal is that you should need to do as little as possible in these sections—ideally nothing at all.
However, if you notice that something is incorrect or needs to be supplemented, you can make adjustments directly in the report. To do so, click on the heading of the section you want to edit.
For information that appears as text under a heading, such as a comment, it is displayed just like a regular text section and can be edited in the same way. Note: Any changes you make here will apply across the entire Stratsys platform.
For information that appears in tables, whether it can be adjusted directly from the report depends on the report’s settings. Either an icon with the reporting block is shown, which takes you to the follow-up window, or you can edit the table directly using inline editing.
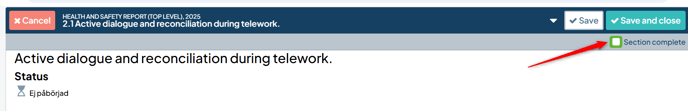
Mark a section as Complete
When you feel that you have finished a heading, you can use a feature called Mark section as complete. This helps provide an overview of what remains to be completed in the report. You can mark headings as complete in two ways: either directly within the reporting view when you are editing a heading, or via Approval mode, which is accessed by checking the box for Approval Mode.
Whether one, two, or no completion marking buttons are shown depends on the report's settings. If you don’t see any completion checkboxes, it may also be due to insufficient permissions in Stratsys. Contact your administrator if you need additional access.
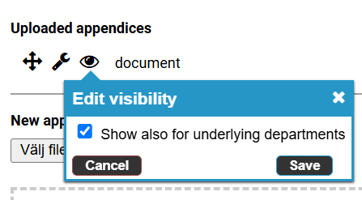
Note: Marking a heading as complete may grant more users permission to read the text. This is controlled by the readability settings of the report—see Reports for more information.
In some cases, headings that are retrieved from scorecards in Stratsys will be marked as complete automatically. This depends on a setting in the report. The report may also use just a green checkmark, both a green and an orange checkmark, or none at all.
Mark as Complete
Approve for completion.
Note: When exporting the report, attachments will not be included and must be exported separately.
This is due to technical limitations related to the file formats used for report exports and attachments.
You may upload any number of appendices, with a maximum file size of 20 MB per appendice.