Configure your analysis views to provide the best possible data foundation when following up on goals, measures, and activities.
Description
The analysis view provides users with valuable information about the node and its linked indicators and activities. It is configured in a similar way to other views by specifying node properties, filter settings, and standard filters, but with fewer configuration options compared to a regular view.
The view is based on the scorecard column to which the node belongs and can display related information for connected nodes.
You configure the analysis view per scorecard column, allowing different configurations for different purposes—for example, one setup for objectives in the Operational Plan and another for objectives in the Sustainability Plan.
The analysis view can be accessed in two ways in Stratsys. The most common method is from the Follow-up window. It can also be opened from views via the node property "Analysis view".
Analysis view in the Follow-up window
You will find the Analysis view on the right-hand side of the Follow-up window under the tab called "Data" which is the first tab at the top.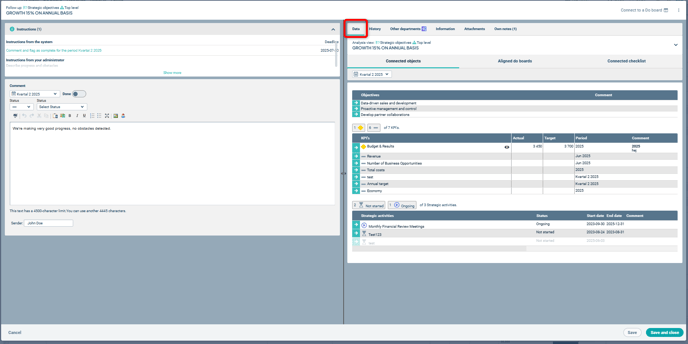
Analysis view from node property in views
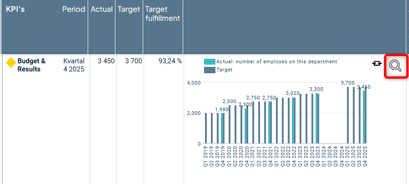
If you have added the node property Analysis View to a column in a view, you can open the analysis view by clicking on the magnifying glass icon.
The view will then open, and from here, as a global administrator, you can modify the properties from the toolbar menu in the upper right corner. This is the same view as in the follow-up window, so any changes made here will also affect the information displayed in the follow-up window.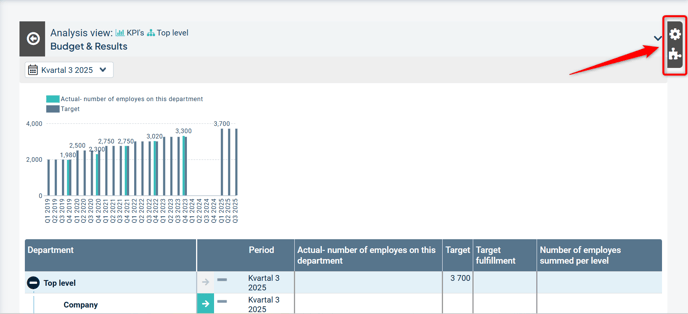
Change the data source in the analysis view
The view is configured similarly to a regular view but with more limited settings. To configure the analysis view, click the context menu in the upper left (three dots), then select "Configure the documentation" ("1" in the image).
The analysis view consists of two parts for distributed objects, usually KPIs and activities, where part of the data source is the actual analysis view ("2" and "4" in the image).
The other part, which displays the underlying levels of this object in a table, belongs to the consolidation view ("3" in the image below, marked with a green frame). To configure that part, see the following article: Consolidation View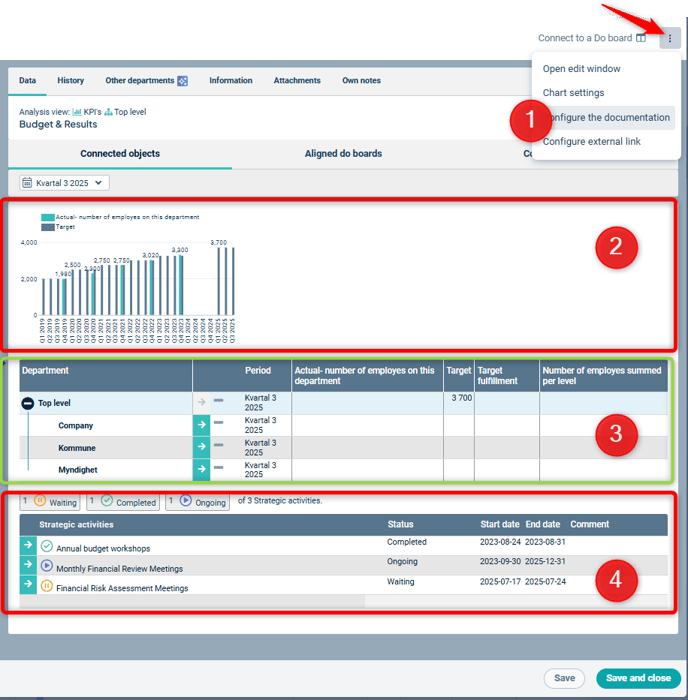
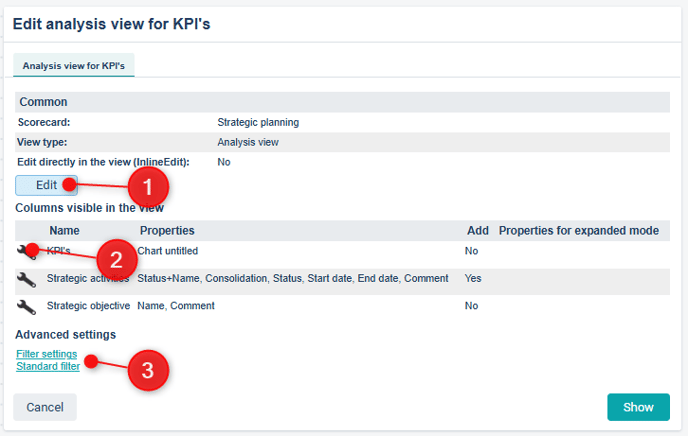
Once you have clicked "Configure the documentation", a dialog appears to modify the analysis view settings.
Under "Edit" in the upper part of the window (1), you can enable Inline Edit, allowing users to edit properties directly within the view.
You can define which columns should be visible and specify their node properties by clicking the wrench icon (2) for each column.
You can set filter settings and standard filters for what should be displayed in the view under Advanced Settings in the lower left corner (3).