![Stratsys-logo-deep-blue.png]](https://www.stratsys.com/hs-fs/hubfs/Stratsys%20Logos/Stratsys-logo-deep-blue.png?height=27&name=Stratsys-logo-deep-blue.png)
What is a Dynamic Table?
The Dynamic Table is a new report section that is currently in beta and is being released gradually to Stratsys customers. The feature combines the strengths of manual tables and previous report sections, allowing you to build and format custom tables directly in reports. You can visualize key figures, goals, and risks in the same table with data retrieved from Stratsys products. The feature also supports official table formats for EU taxonomy reporting and simplifies the setup in Sustainability Reports.
How do I get started with the functionality?
-
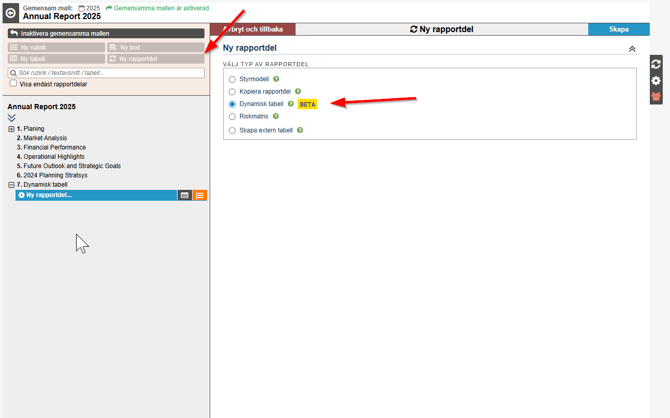
Add a new report section under the heading where the table will be displayed.
Stand in the common template for a report, choose a heading, and then select "New Report Section" - Dynamic Table.
-
Click on Change Table to open the administration page for the table.
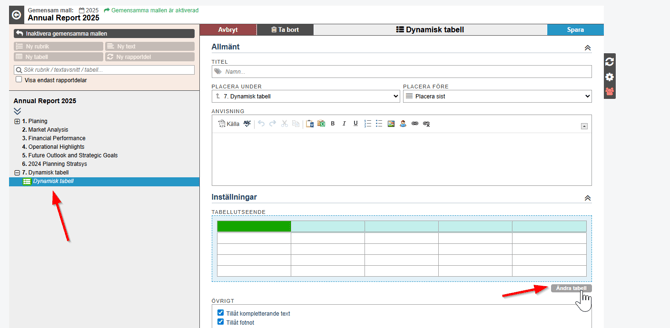
Build and format the table according to your needs.
For example, select key figures, risks, or goals for the table. In the example below, we will add a scope that we want to show the outcome via node properties between 2023-2026.
In our case, we choose "Scope" in the first column.
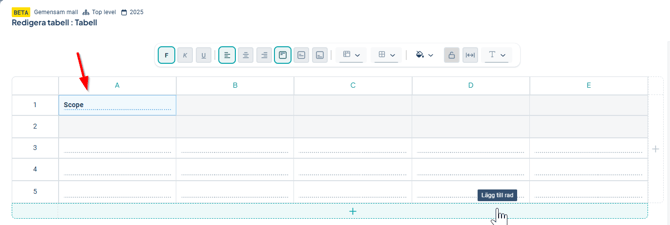
3.2 Then select, for example, cell A2 where you:
- Select the row where the object should be displayed.
- Click on Insert an Object.
- Choose which object you want to show in the table.
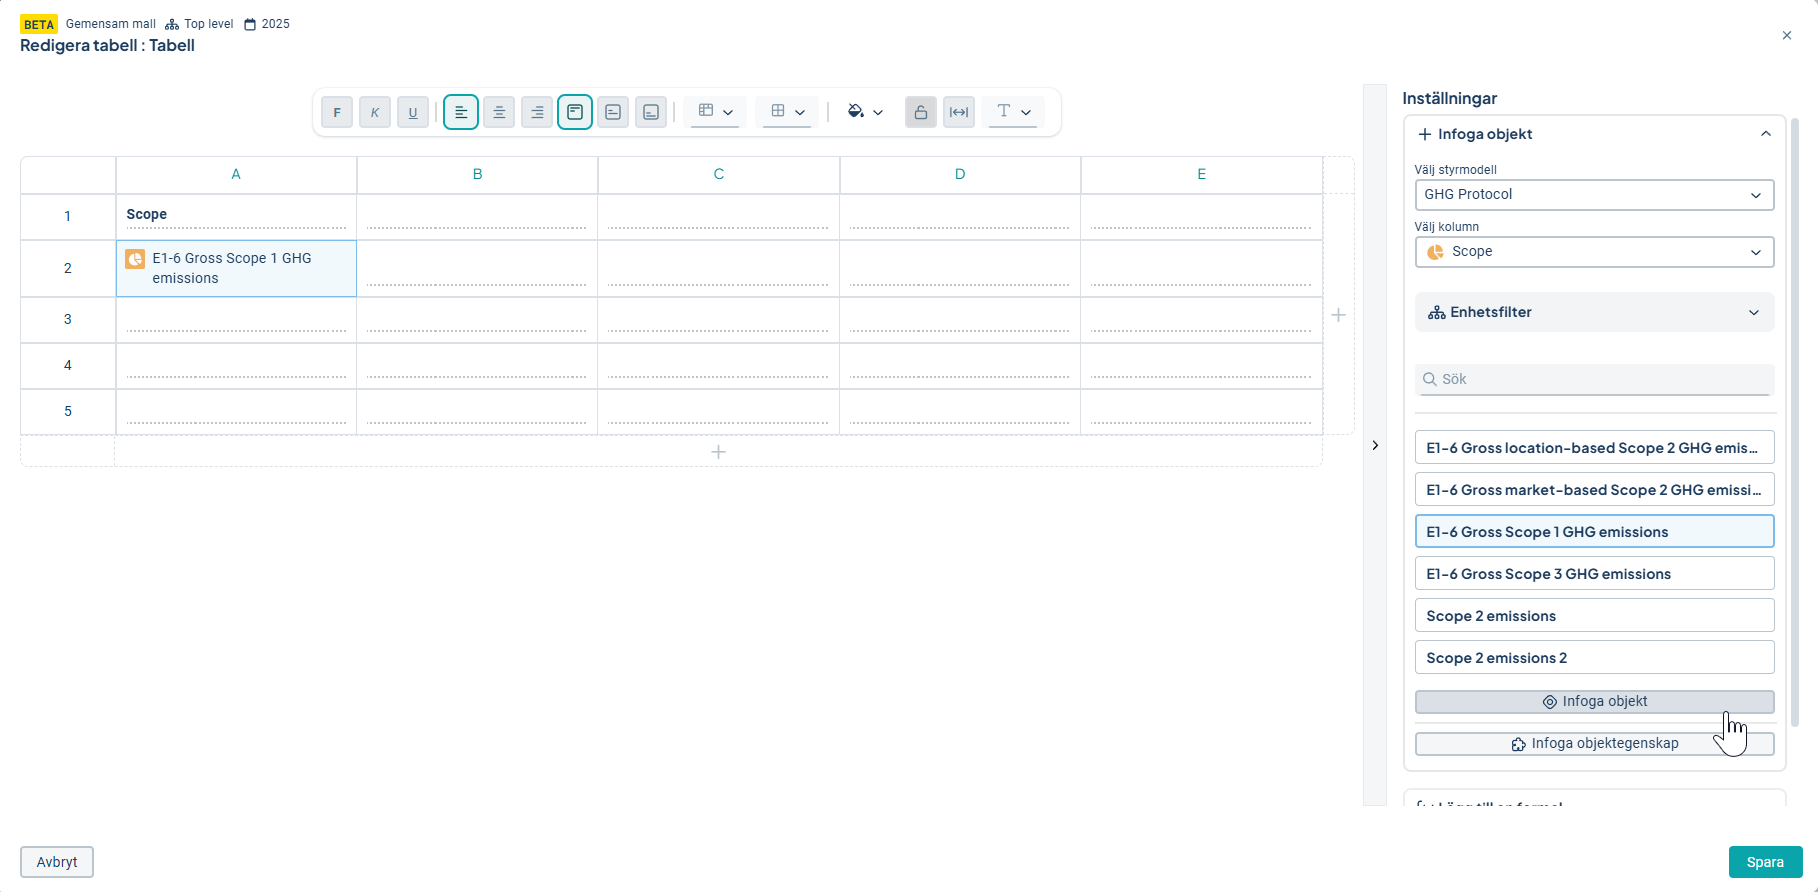
3.3 Select node properties
Select object properties per column:
- Mark the column where the properties should be displayed.
- Choose which object properties should be included (the same logic as in normal report sections).
In our case, we mark the columns to the right of A1, here we select a metric data column that exists in the metric: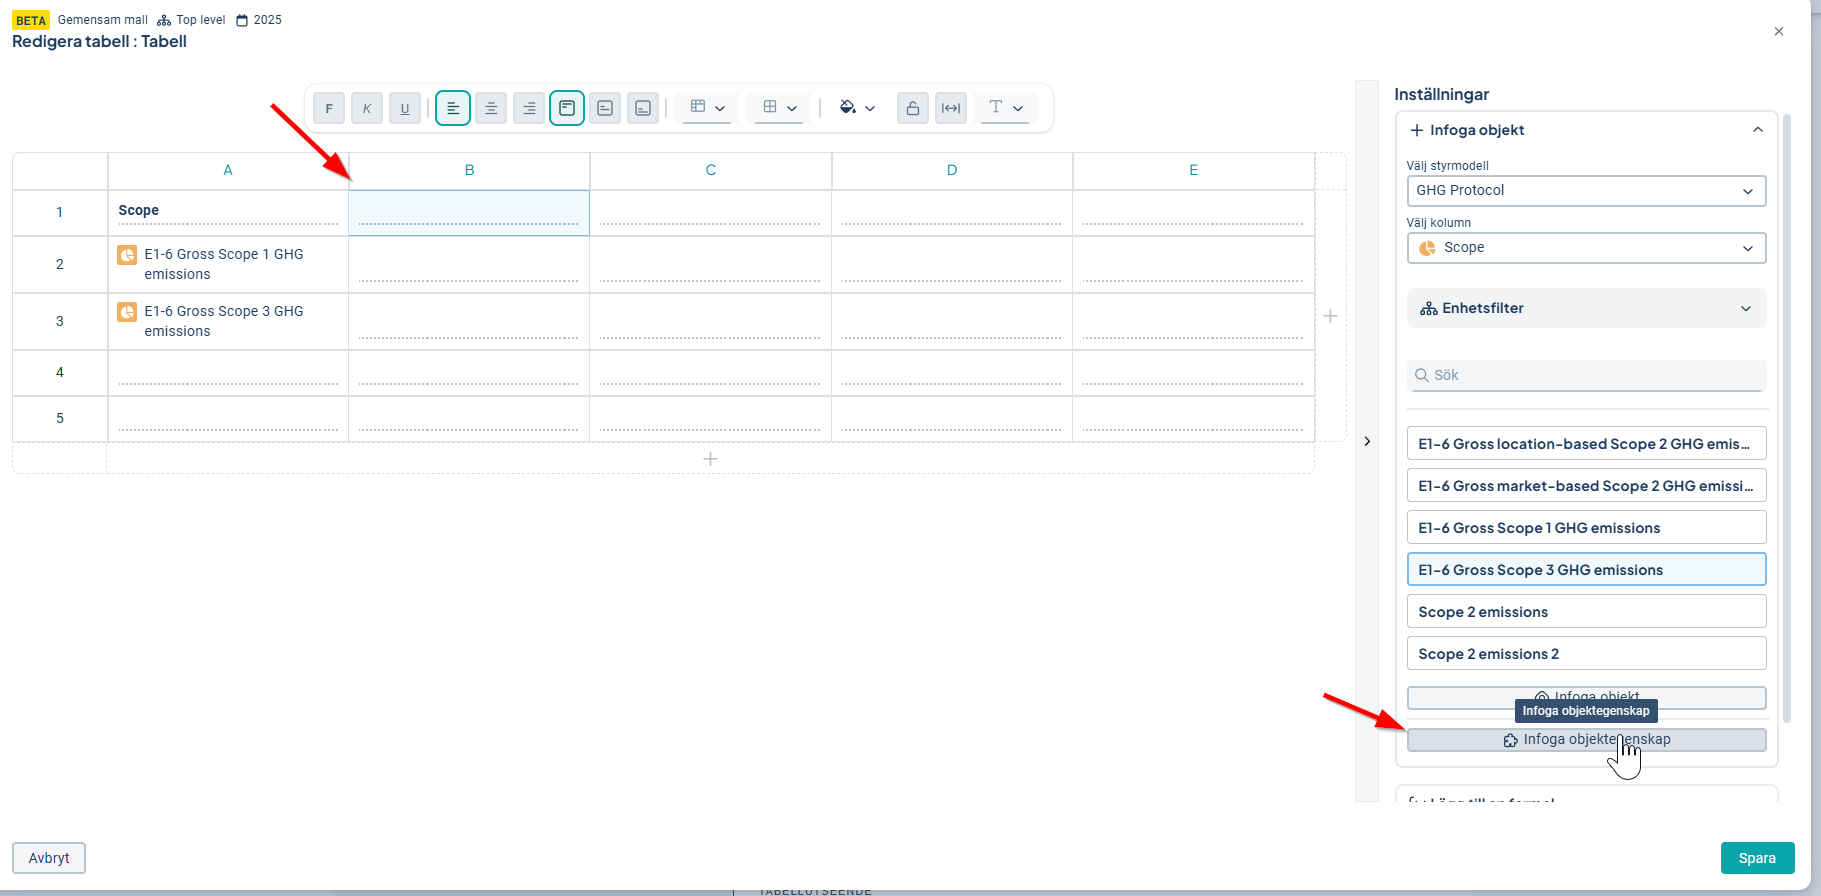
We then choose to periodize the metric data column and click save: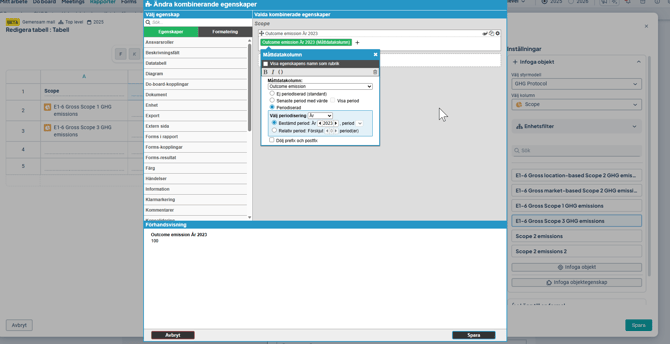
We can now see that the properties are automatically retrieved into the cells below (B2 and B3 in this case).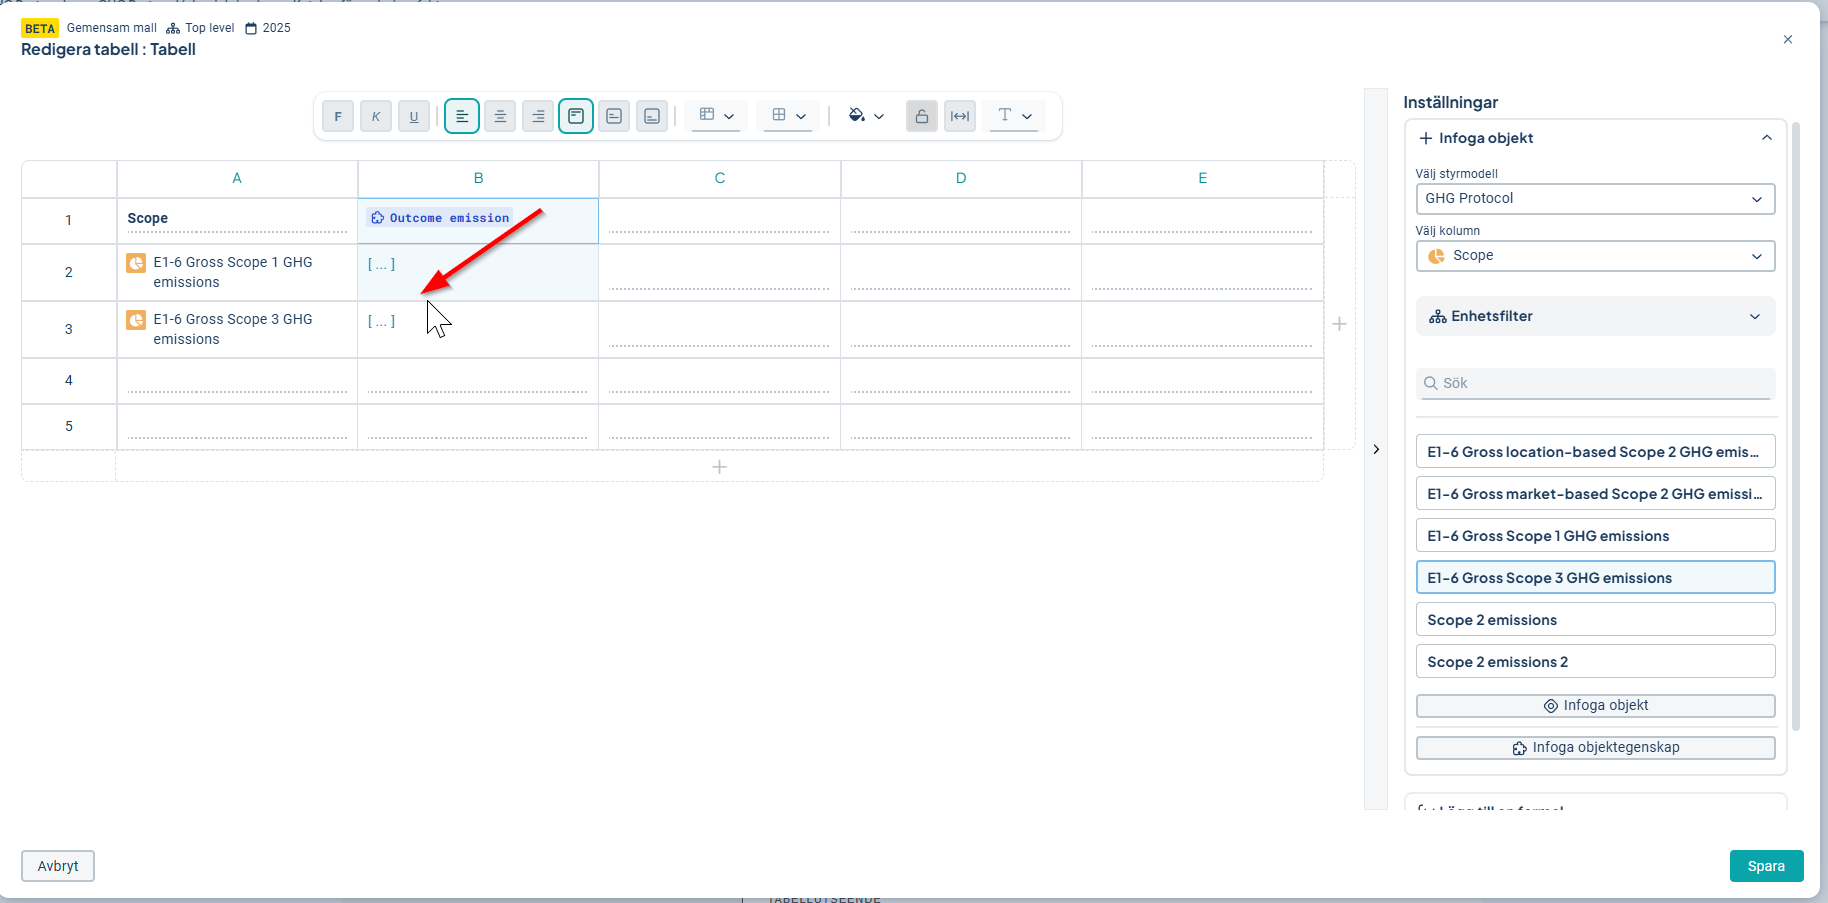
We do the same for 2024, 2025, and 2026, where in the final step we click save: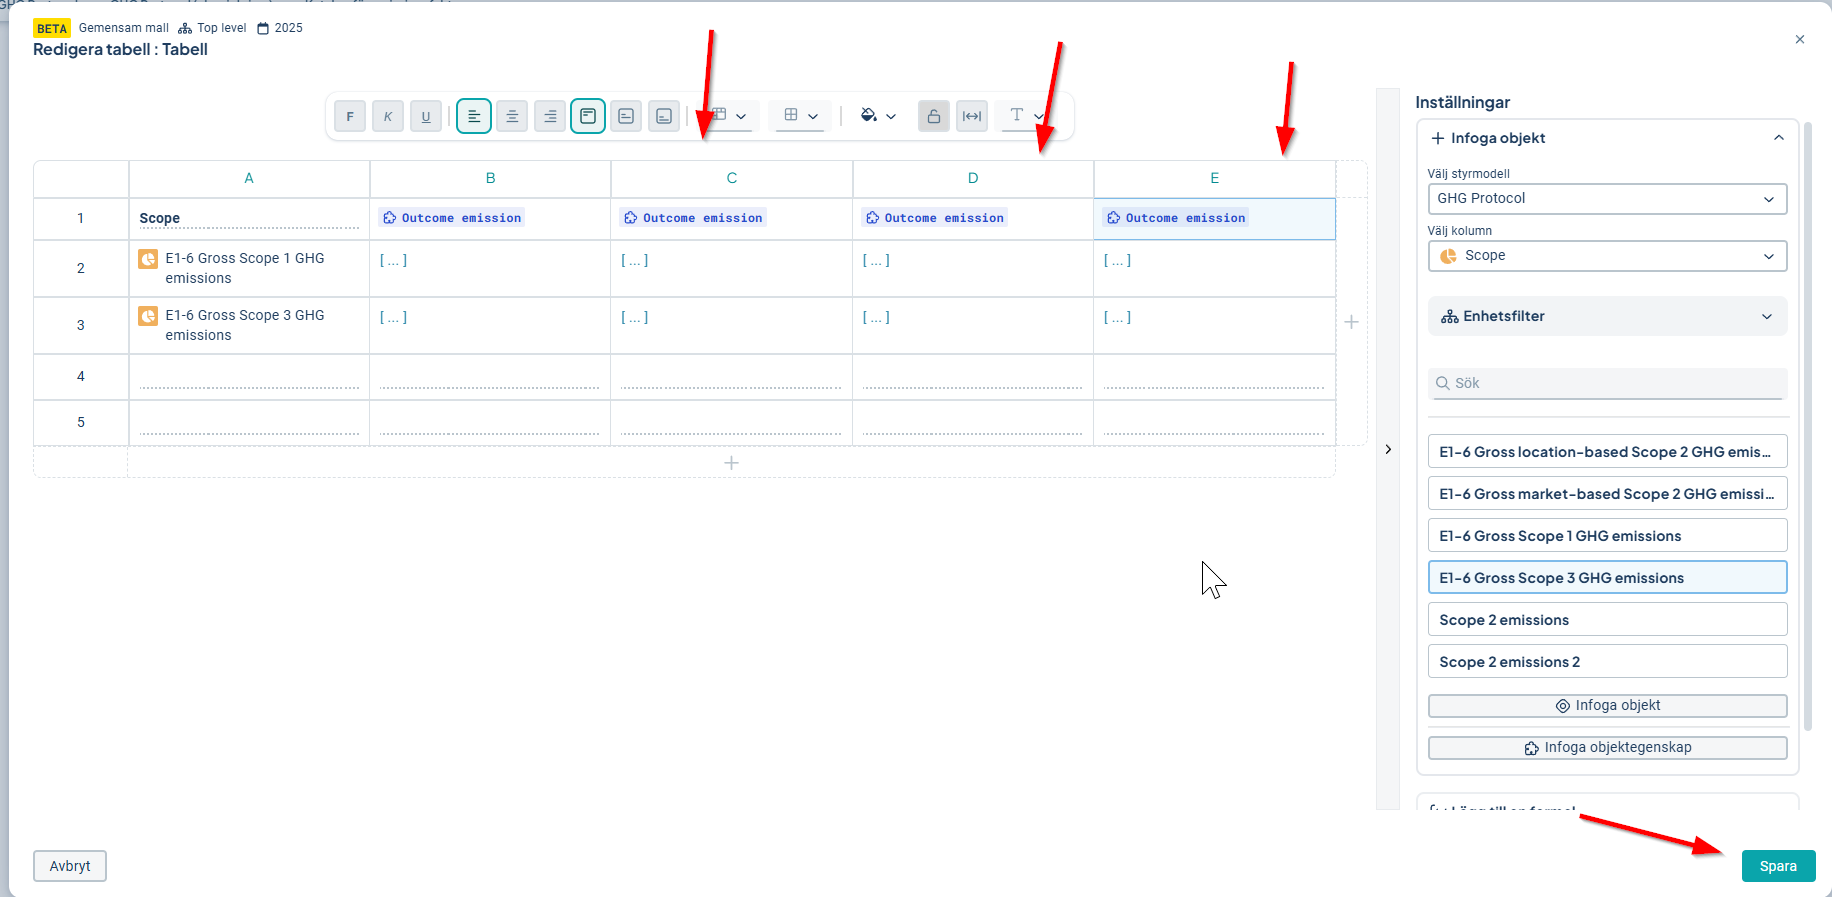
3.4 Show Report
When we then go to "Show Report," we see that the values for the metric data columns from the metric have been retrieved and displayed in the report: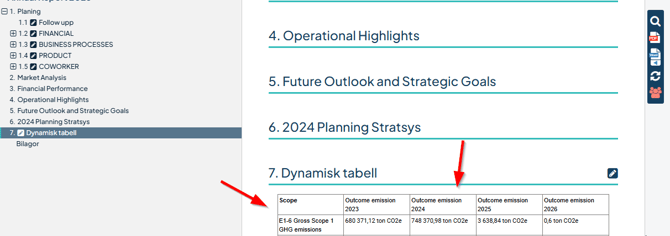
Important Limitations
- You can only select objects per row, and object properties are displayed per column, not vice versa.
- It is not possible to copy this report section within the report.
- Not all formatting is supported, but it will be updated continuously.
How can the table be used
- EU Taxonomy Reporting: Create the official table formats and fill them with relevant objects and properties without needing multiple separate report sections.
- Sustainability Reporting: Gather KPIs, goals, and status in one single table for a clear overview per department or focus area.
- Risk Overview in Business Management: List selected risk objects in rows and display probability, consequence, and action status in columns for quick follow-up.