- Manual
- Object / node settings
- Charts and analysis of measurements
-
Get started with Stratsys - for users
-
FAQ
-
My work and Communication area
-
User administration
-
Views and Scorecards
-
Object / node settings
-
Reports
-
Forms and Do board
-
Stratsys AI
-
Other - administration
-
Platform Center
-
Guides for easier use
-
Integrations
-
Due Diligence
-
Meetings & Do-board
-
Our products
-
Accessibility
-
Uncategorized
Dual Y-axes in charts
Use dual Y-axes when more than one measure data column is included in the chart.
Description
It is possible to configure dual Y-axes in measure charts, which can be useful if you want to visualize measure series with different value ranges. An example could be displaying actual values in absolute numbers and goal fulfillment in percentages in the same chart in a clear way.
Read more about measure charts here.
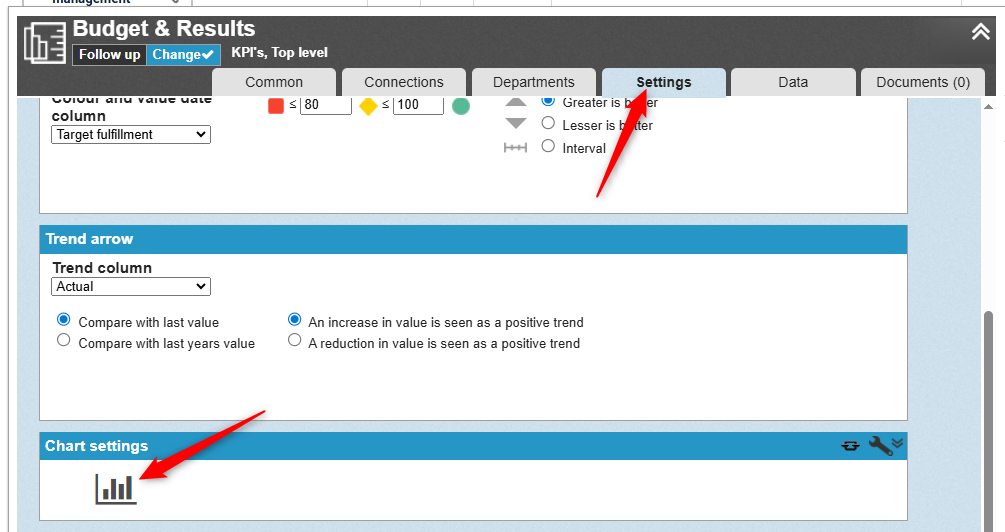
Open the measure and go to the Settings tab/section.
In the classic edit window, scroll down to the chart icon and click it to access the chart settings. The measure will be saved when you navigate to these settings.
1) Select which data series you want to display and how (from a template or specifically for this measure)
2) Choose which Y-axis the data series should be displayed on
3) Set the minimum and maximum values for your Y-axes and save when you are satisfied with the preview of your chart
Image from the settings in the new object window:

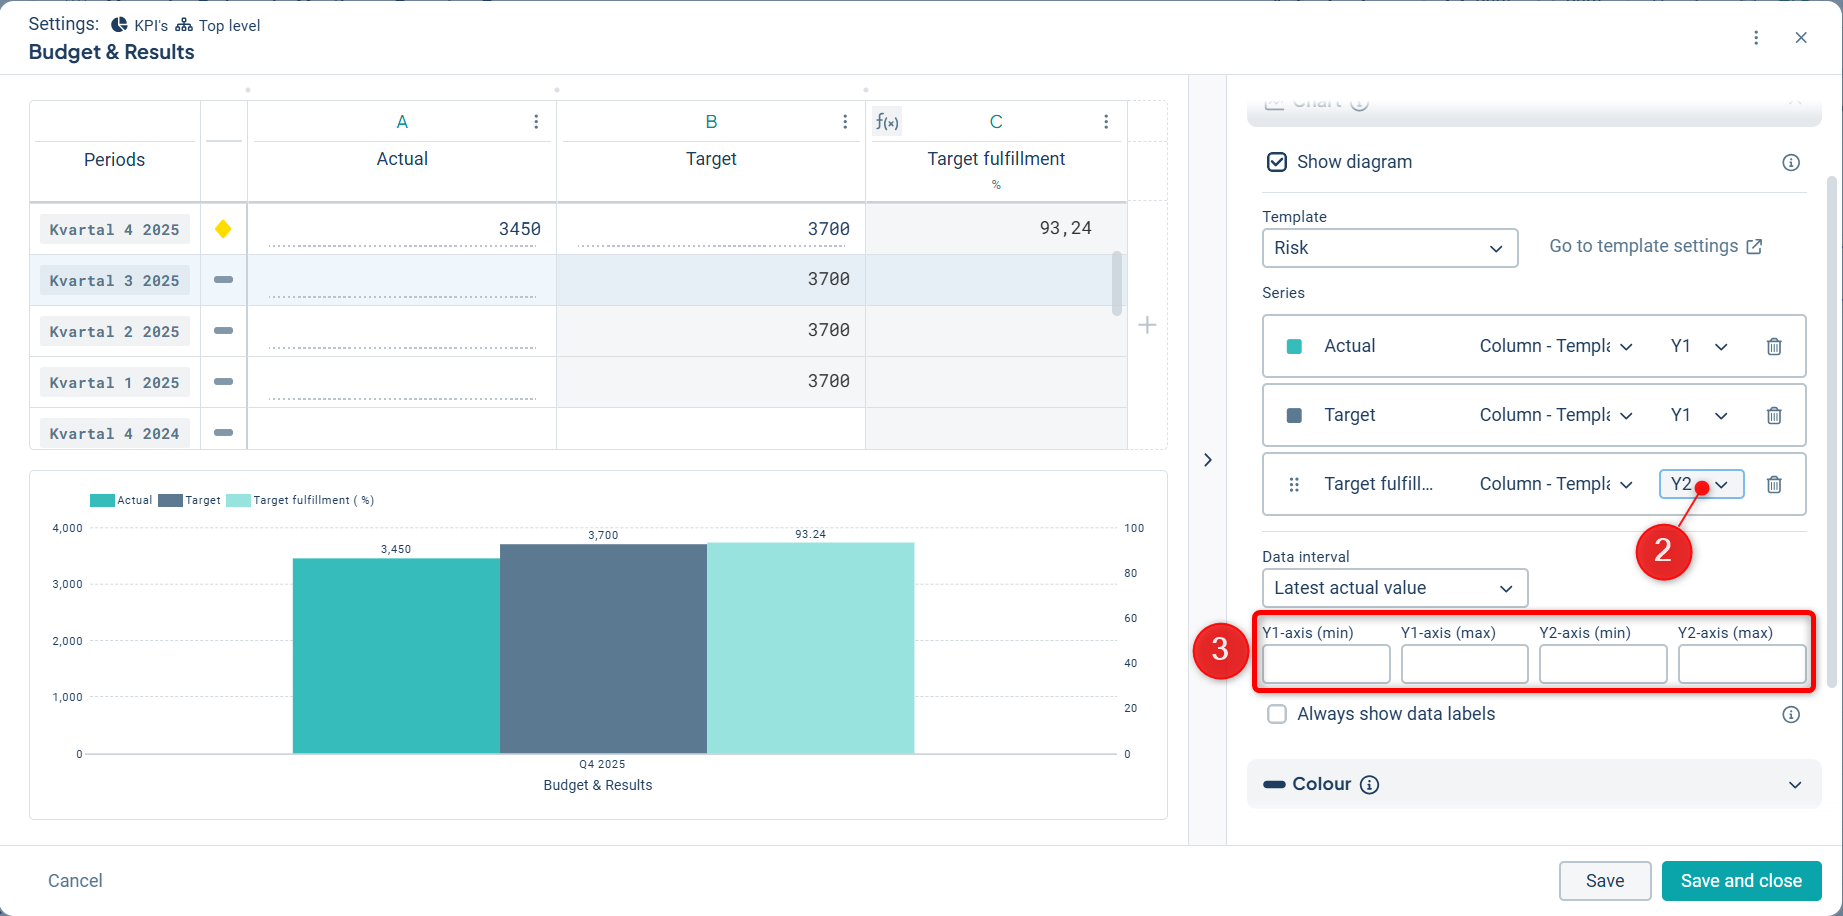
Image from the settings in the classic edit window: