A connection is a relationship between two objects and is used to display information that is naturally linked
Planning Version and Connections
Description
The information stored in Stratsys is saved in objects (also called nodes). There are three types of objects: text objects, measure objects, and activity objects. Objects are created on a department and can be made visible or copied down to multiple departments within the organization.
Each object belongs to a model column in one of your scorecards. Each model column contains only one type of object: text, measurement or activity.
The information in the objects across different model columns is linked together through connections, and this article describes how these connections work.
What is a connection?
A connection is a relationship between two objects and is used to show how information is logically linked.
The connection can be said to be directed to the left in the system.
In the image below, the Objectives are connected to Strategic Objectives, and the Strategic Objectives is connected to Focus Areas. The Curriculum Area is connected to a Committee Goal, which in turn is connected to the vision / the scorecard itself.
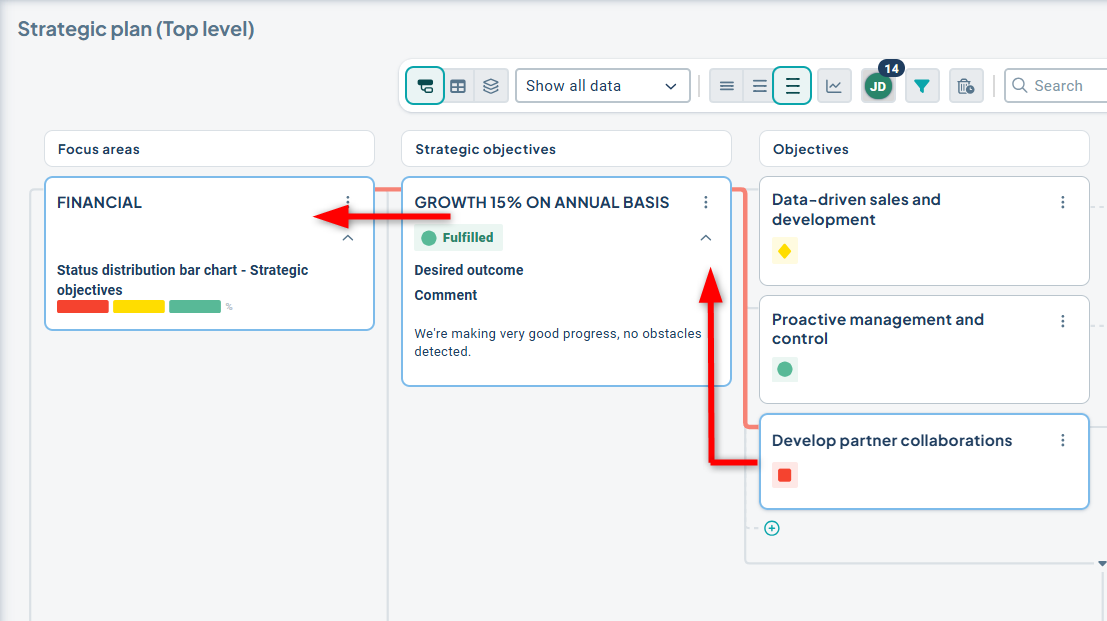
How objects are displayed in views and report sections is controlled via filters. If a specific object is included in the filter, such as the Committee Goal above, then the associated areas, goals, and activities connected to the Committee Goal will also be displayed. If a specific object is not displayed, then the objects connected to the right will not be displayed either. The connection chains are thus linked when displaying objects, so that you see relevant information.
Click here if you want to read about how to visualize connection chains from the updated view.
How can you connect objects?
In general, you can connect an object to other objects that are located to the left in the structure.
To connect two objects, both must exist or be visible at the unit level where you want to make the connection.
Additionally, the connection rules must permit a connection between the two scorecard columns in which the nodes reside – see more on this below.
You must also have permission to save the object, as the connection modifies the object's information.
The first connection is created automatically when you create a new object. In the image below, the strategic activity will be connected to the goal indicated by the red thread when you click the plus sign to create it. Blue outlines will also appear around the connected objects.
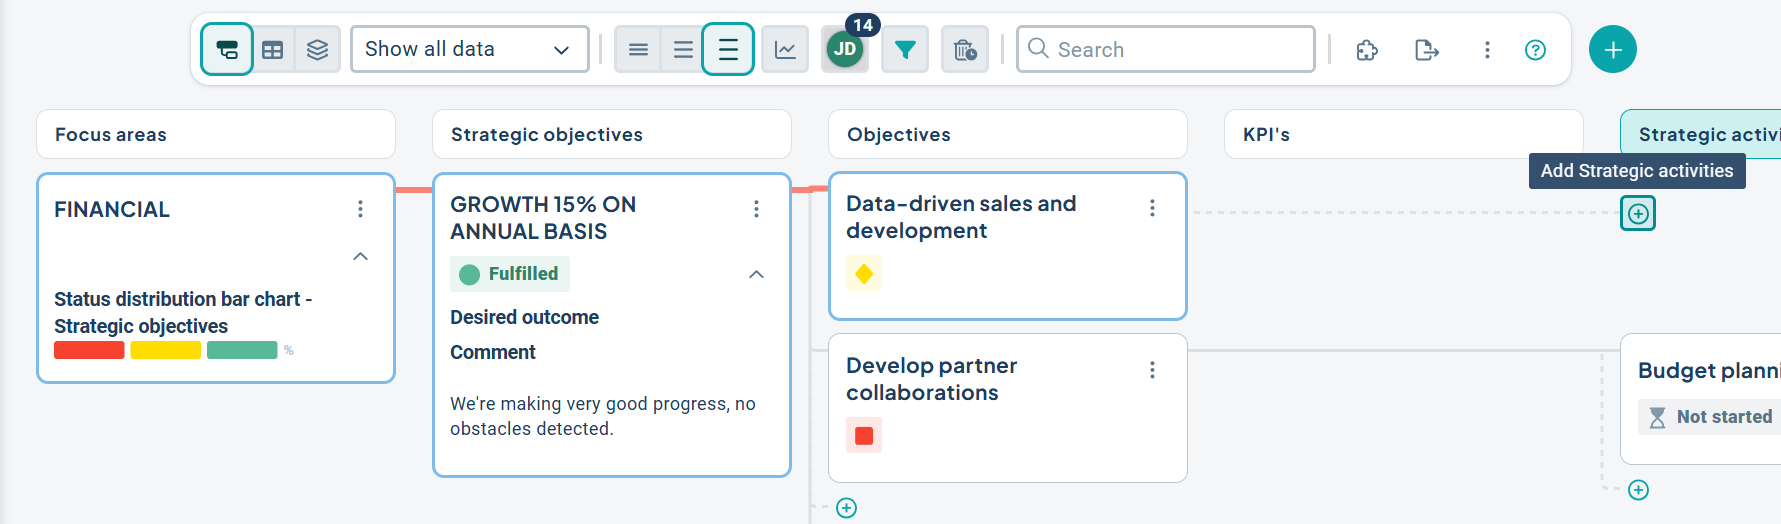
To create an object, it must always be possible to connect it to another object at the same department level, or the connection rules must allow a direct connection to the vision/scorecard.
You can connect as many objects as you like to another object – for example, here are three objectives linked to one strategic objective.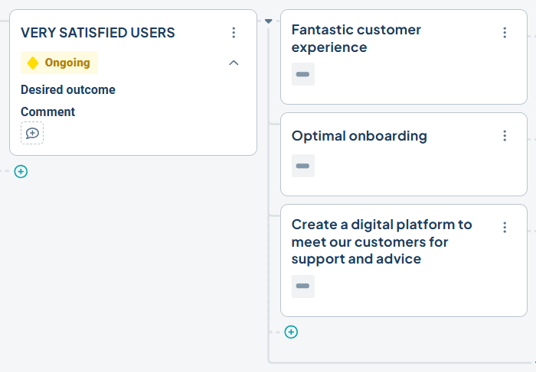
You can also link an object to several other objects by adding additional connections — for instance, linking a goal to multiple strategies that apply to the goal. In such cases, the object will be displayed in all the places it is linked. It may appear as if there are duplicates of the object, but it is actually the same object connected to multiple other objects.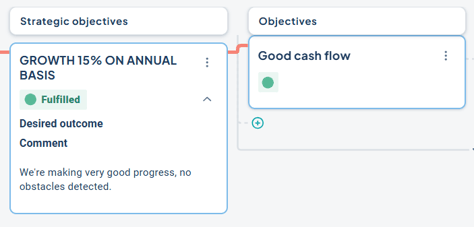
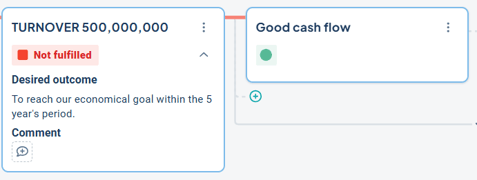
Illustrative example: The objective "Good cash flow" is linked to both strategic objective "Growth 15% on annual basis" and "Turnover 500,000,000" and therefore appears twice in the view.
It is also possible to link an object to objects in other scorecards, which is often used for measures/key figures that are relevant across different areas — for example, in both the operational plan and the school’s systematic quality work. In this case, the scorecard settings must also allow objects to be selected into the other scorecard.
Connection Rules
How you can link objects is governed by the linking rules found in the settings for Scorecard Columns.
Since every object must have at least one link, these rules also determine where you are allowed to create the objects.
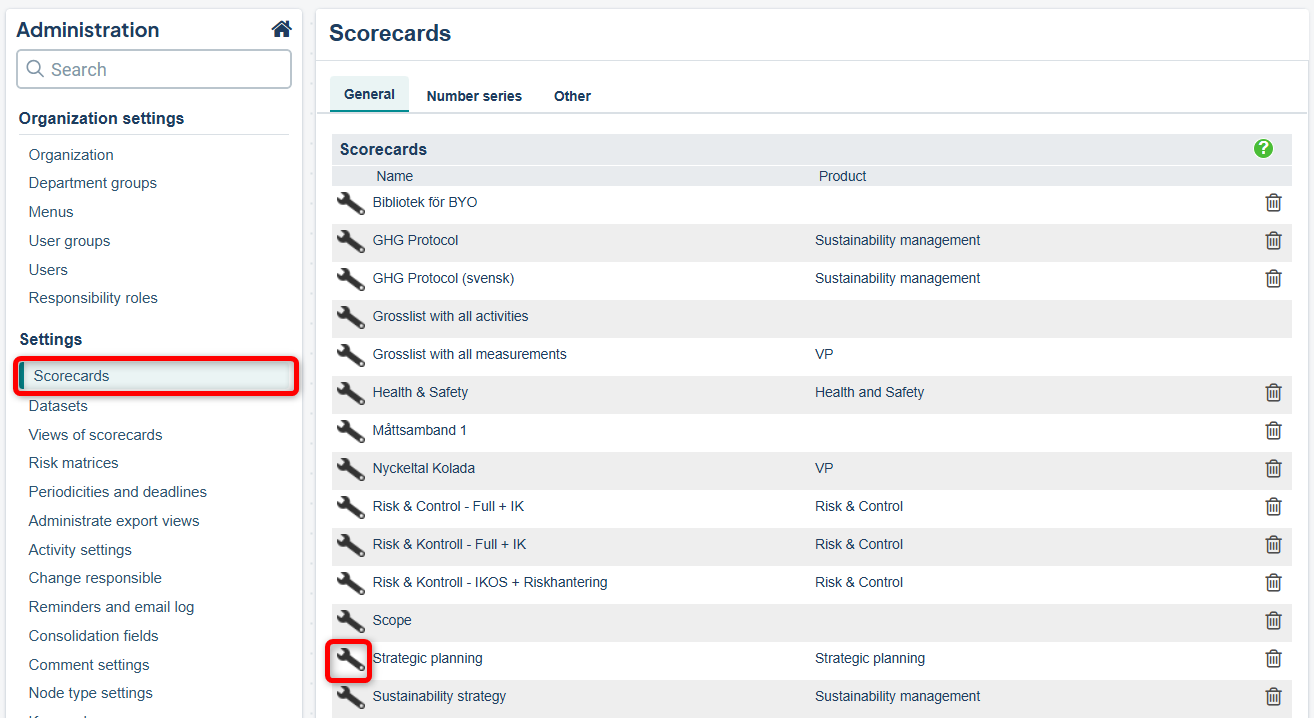
To access the settings, navigate to Administration. In the left-hand menu, click on "Scorecards". Then click the wrench icon for the scorecard where you want to adjust the settings.
Then find the column where the changes should be made and click the gear icon on the right.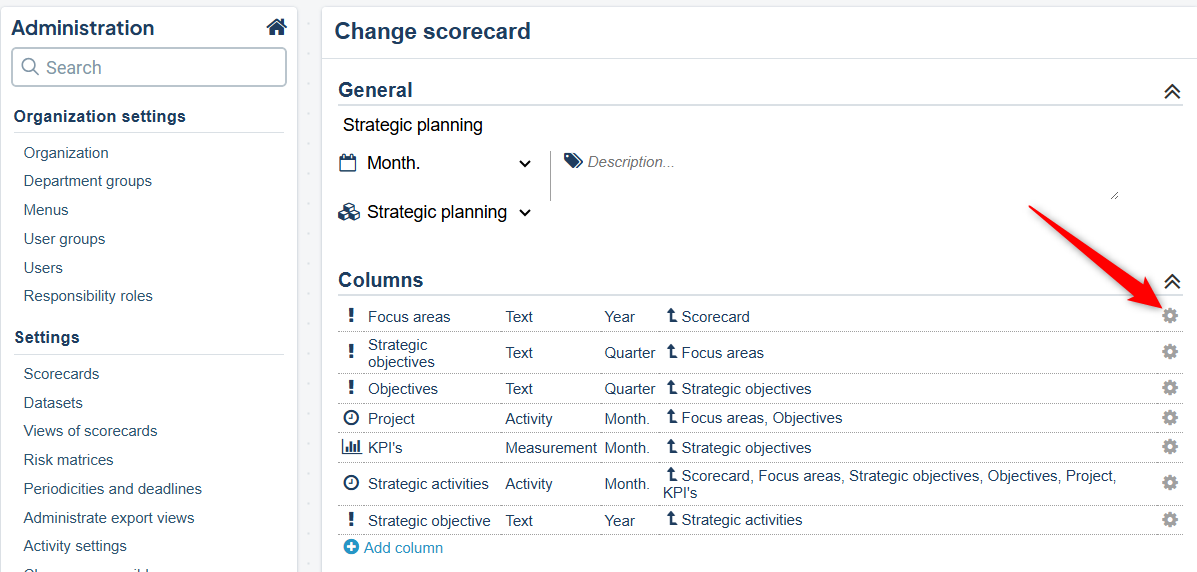
The connection rules can vary between different scorecard columns, and they often differ for various department groups in the organizational tree.
Below is an example where indicators can be linked/created against different objects depending on where you are in the department tree, where green checkmarks indicate allowed connections.
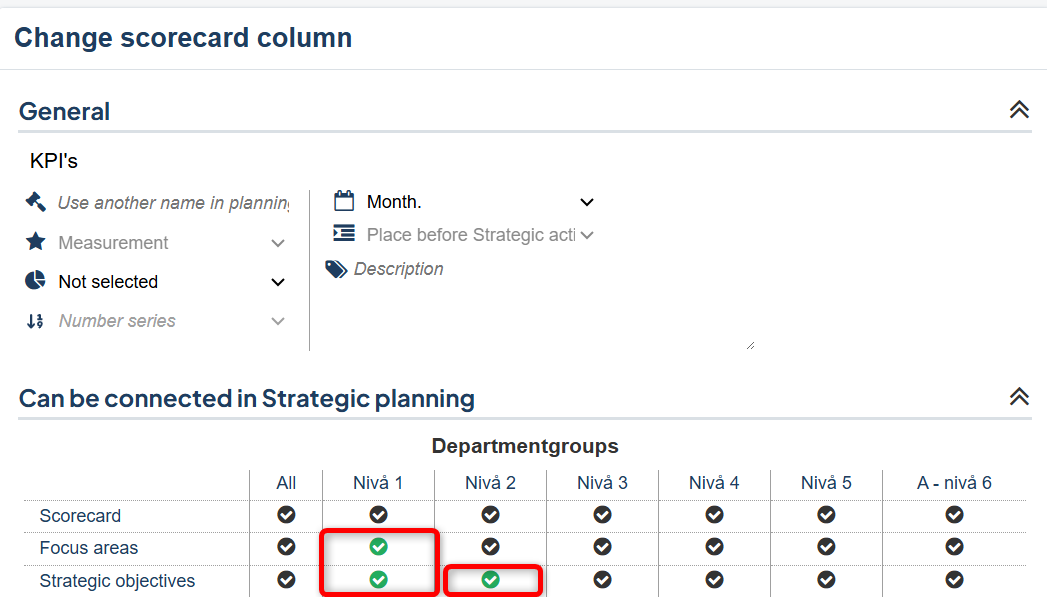
In the example above, indicators can be linked to Goals and Strategies if you are on a unit that belongs to the "Level 1" unit group; but only to Goals if you are at "Level 2" in the organization. On other levels/unit groups, you can neither link nor create indicators.
In order for the node to be linked to another scorecard, the property “Can be selected into other scorecards” must be enabled for the scorecard column.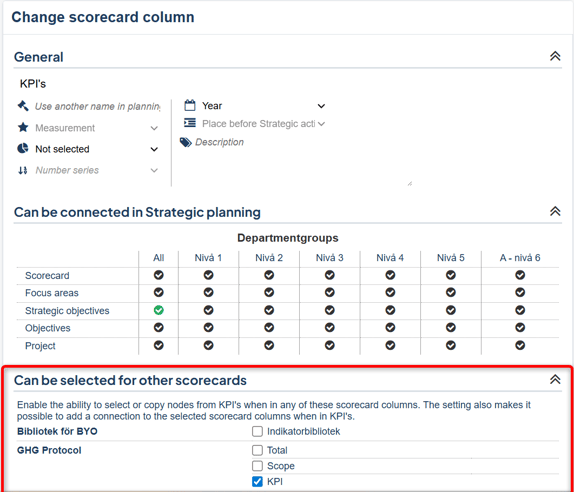
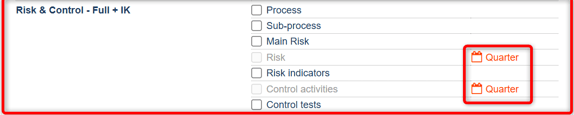
Both the other scorecard must have a column of the same type (text, metric, or activity object) and the columns must have the same periodicity in order to allow selection into another scorecard column.
Read more about linking rules in the article about Scorecards.
Change an existing connection
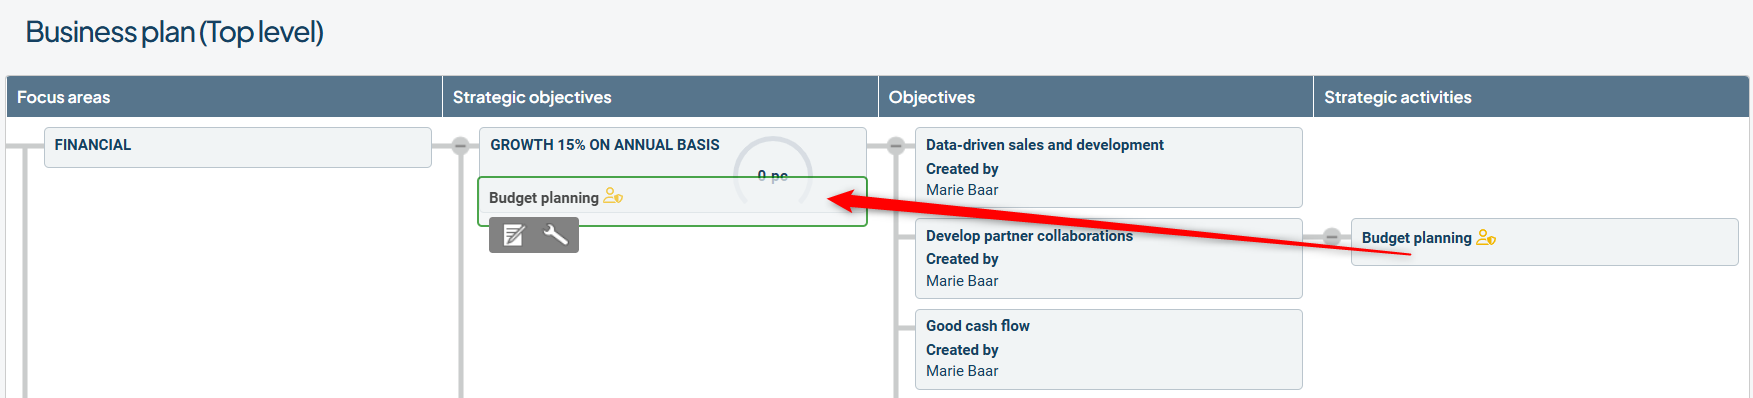
In a drag-and-drop view (in Classic View), you can change links simply by dragging and dropping the object onto another node, provided you have permission to edit the node and the linking rules allow the new connection. A green border around the object you want to move indicates that the new link is allowed.
You can also change the links via the object's edit mode.
As this works differently depending on the interface, we refer you to this article if you're using the Object Window: Object Window: Connections
If you're using the classic edit window, continue reading here.
Click the "Connections" tab and modify an existing by clicking the wrench icon to the left of the link.
If you cannot access the edit mode for the link, it may be because you're on a lower-level node and the node exists at multiple levels in the organization. Switch to the top unit where the node is located and try again.
In the image, we see an Objective linked to a Focus Area.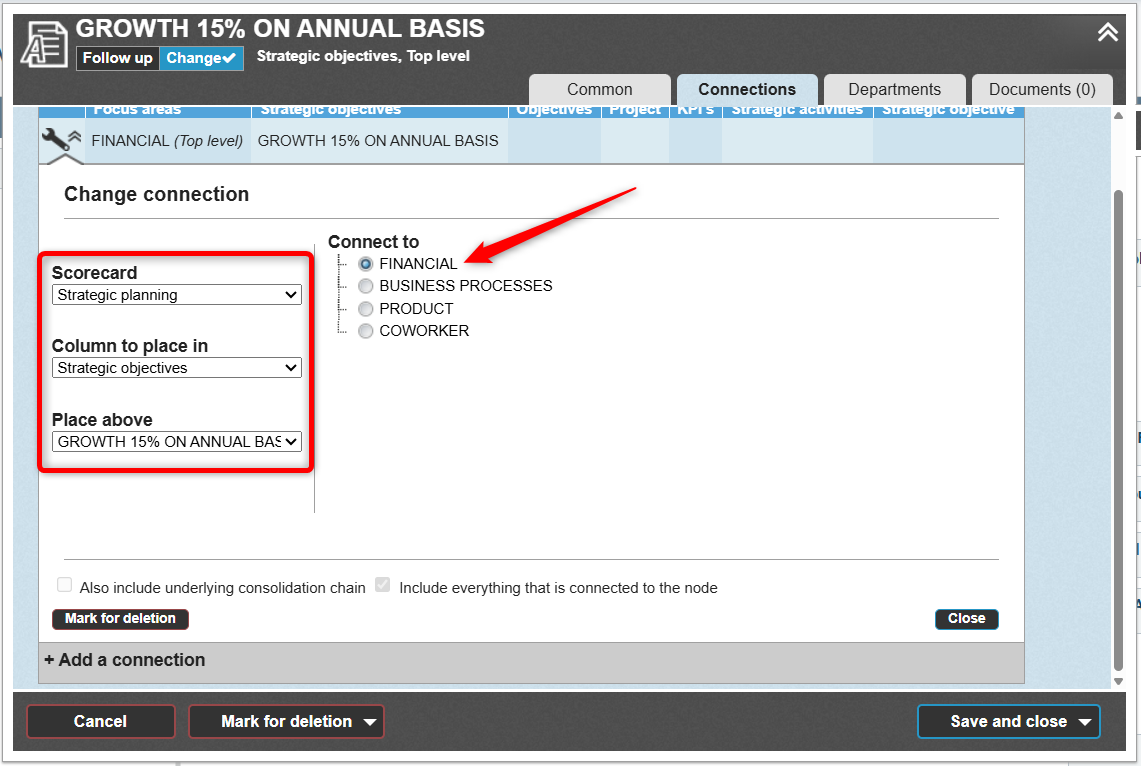
You can re-link the node to any nodes that have a radio button.
Under connections, you can also move the link to another Scorecard and another Column if the linking rules allow it, and change the order by adjusting the placement in “Place above.”
When you change a connection, everything linked to the node on the right will also follow automatically. Normally, links on underlying departments will also follow, but this may depend on settings.
Add Connections
You can add a connection via the object’s edit mode, provided you have the necessary permissions.
Since the functionality differs depending on the interface, please refer to this article if you are working with the Object Window: Object Window: Connections.
If you are working in the classic edit window, continue reading here:
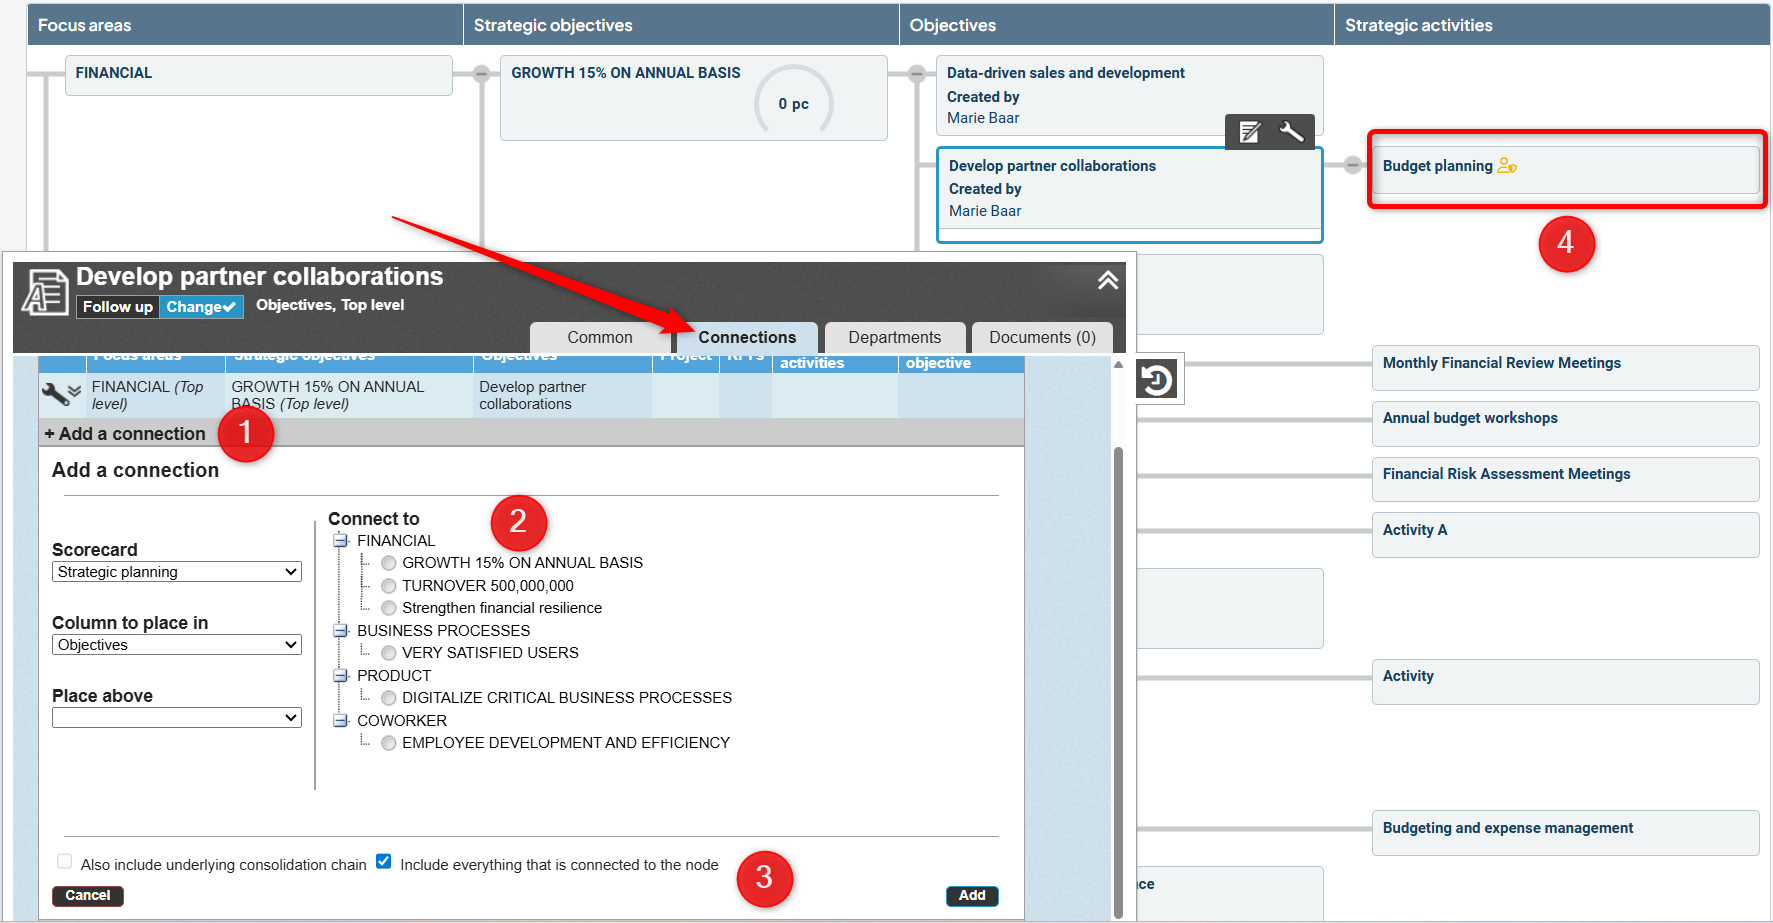
Click on the Connections tab.
1) Click Add Connection. If you do not see the “Add” button, it may be because you are on a subordinate node that exists at multiple levels in the organization.
2) Select your new connection (if you want to connect to another scorecard, start by selecting it in the left-hand box).
3) Choose whether to include all elements linked to the node. In the example image, you can decide whether activities (4) should also receive the new connection. If you leave the box empty, only the goal will receive the new connection. Any subordinate connections will follow the new connection if such exist—in this case, there are none, as it is a text node.
When a node has more than one connection, it may appear multiple times within the same view.
In the example below, "Measure SYD A" has two connections—one to "Digitalization" and one to "Process". This is not displayed with two lines from the same node, but rather as two separate boxes—however, it is the same node being shown.
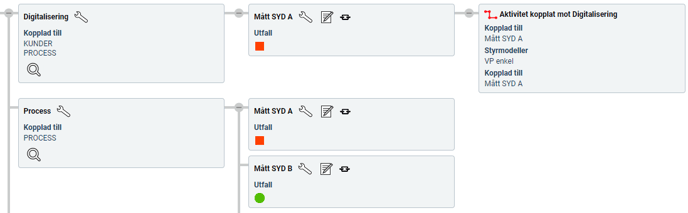
This is displayed in this way to clearly show the connections on the right-hand side.
In this case, the activity "Activity linked to Digitalization" will be removed if the connection between "Measure SYD A" and "Digitalization" is deleted—but not if the connection to "Process" is removed.
Remove Connections
You can remove a connection via the object’s edit mode, provided you have the necessary permissions.
Since the functionality differs depending on the interface, please refer to this article if you are working with the Object Window: Object Window: Connections.
If you are working in the classic edit window, continue reading here:
1) Click on the Connections tab.
2) Expand the connection by clicking the wrench icon for the connection you want to remove.
If you cannot access the edit mode for the connection, it may be because you're on a subordinate node that exists at multiple levels in the organization.
3) Click the Delete button.
You cannot remove the last connection—doing so would be the same as deleting the node itself, as a node must have at least one connection to exist.
If the Delete button is not available for the connection, you can instead choose to delete the node.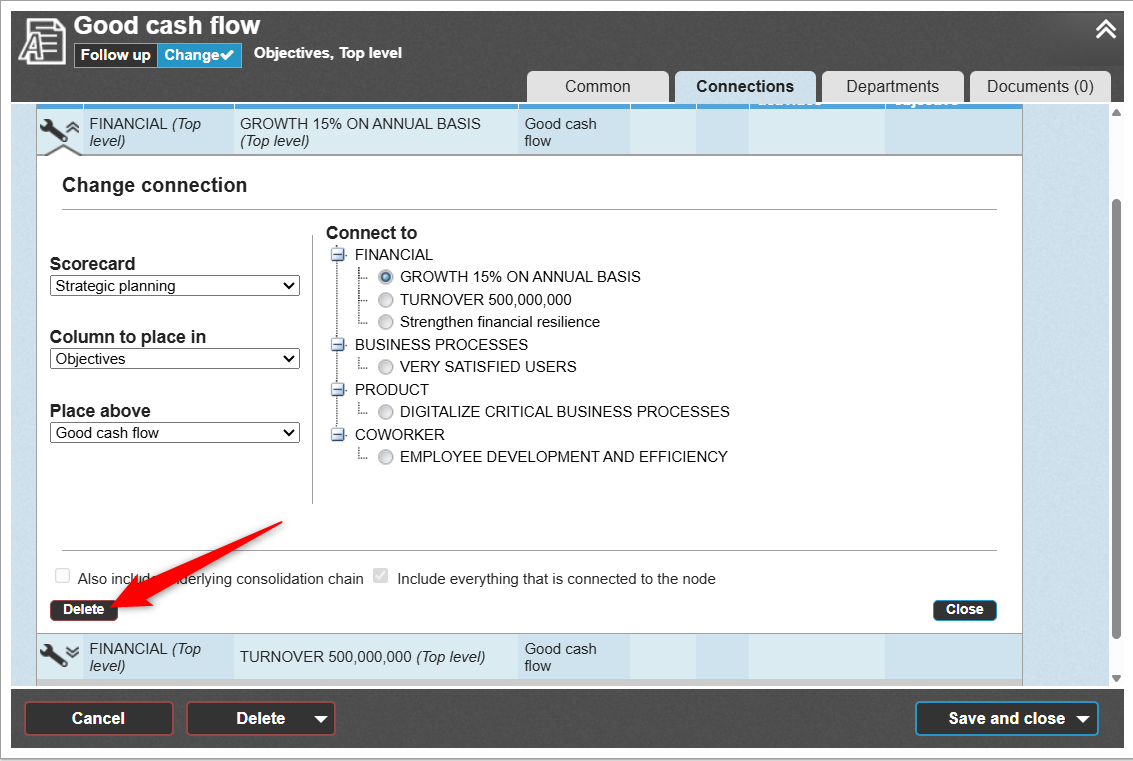
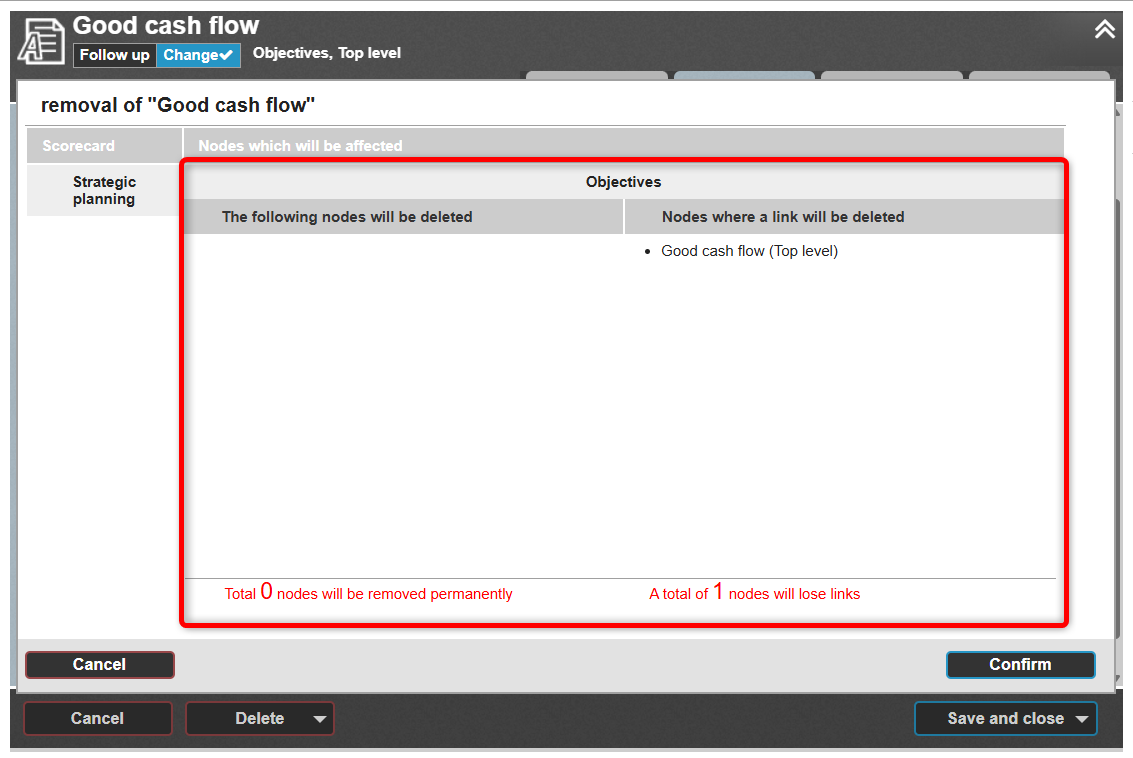
When you remove one of multiple connections, only the selected connection branch is deleted. However, this may result in other nodes—those that exist solely on this connection branch—being permanently removed.
Measure and activity nodes will retain a connection to their respective Grosslists even when their last "standard" connection is removed. These nodes can then be found in the lists and reconnected if needed.
You will be shown a summary of what will happen before confirming the deletion—review this carefully to avoid any unintended consequences:
Undo Deleted Connection
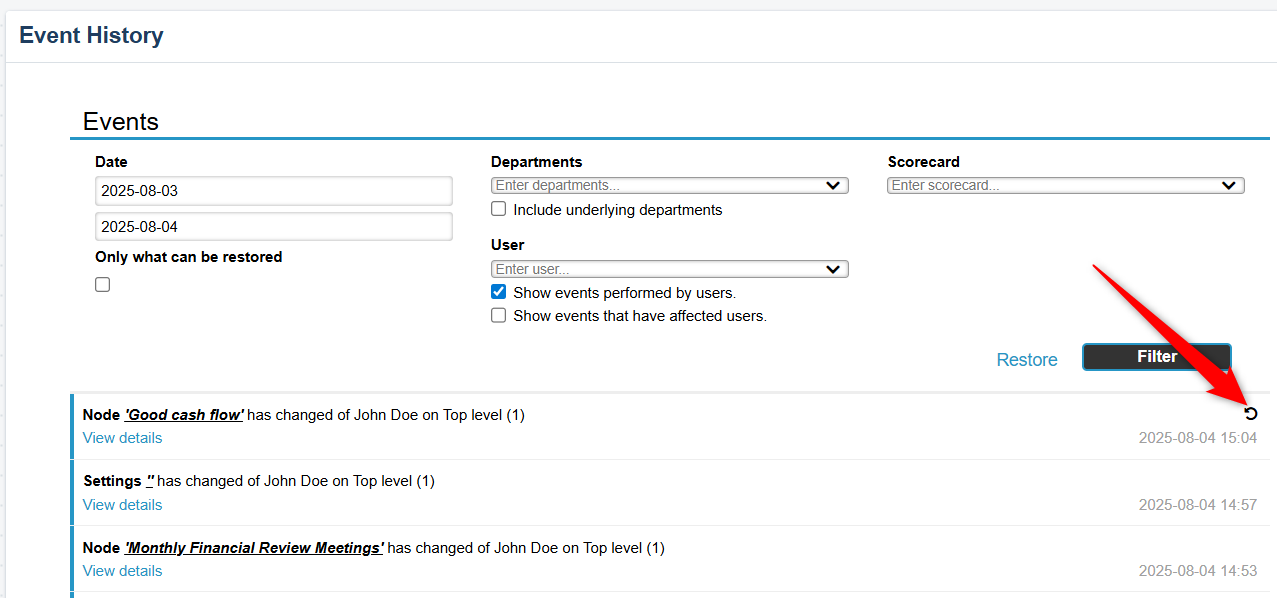
In most cases, you can undo a deleted connection via the Event History.
If you're having trouble locating the event, and you are a Full Administrator, you can contact Stratsys Support for assistance.
Planning Version and Connections
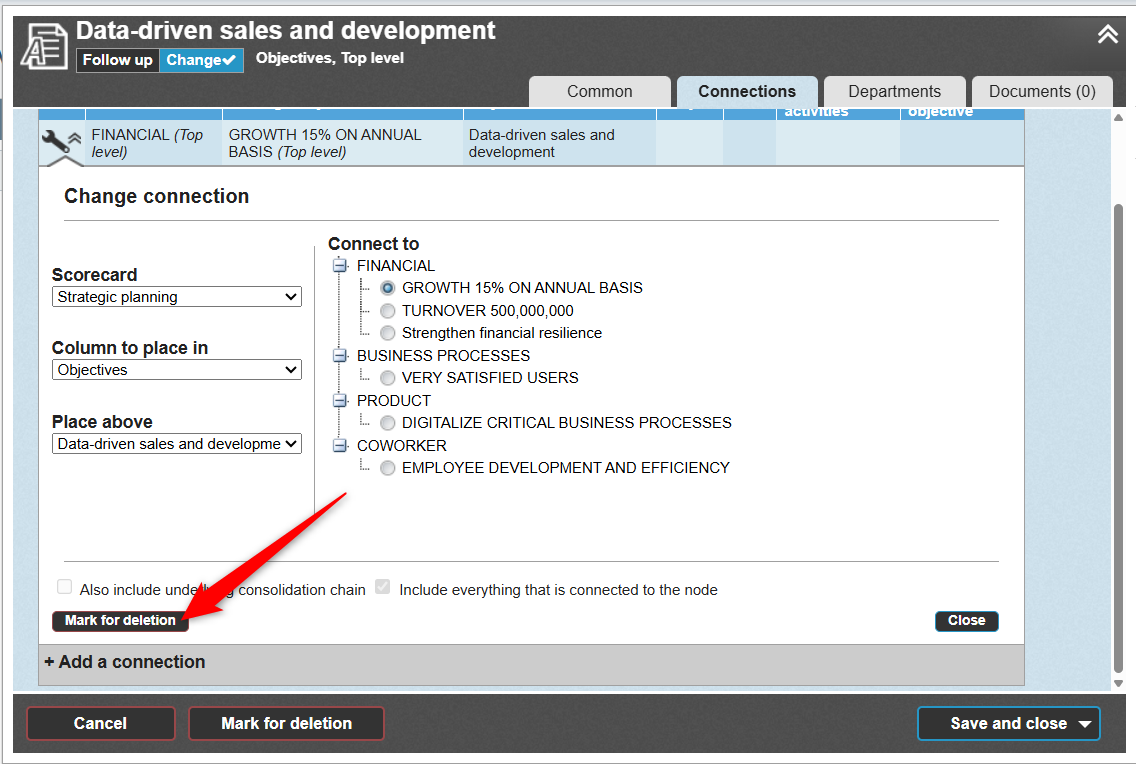
In the planning version, you can mark a connection for removal. The connection will then be removed during version management.
Once a connection has been marked for removal, this action can be undone in the edit mode.
Note: This functionality is currently available only in the classic edit window.
Display Connections in Views
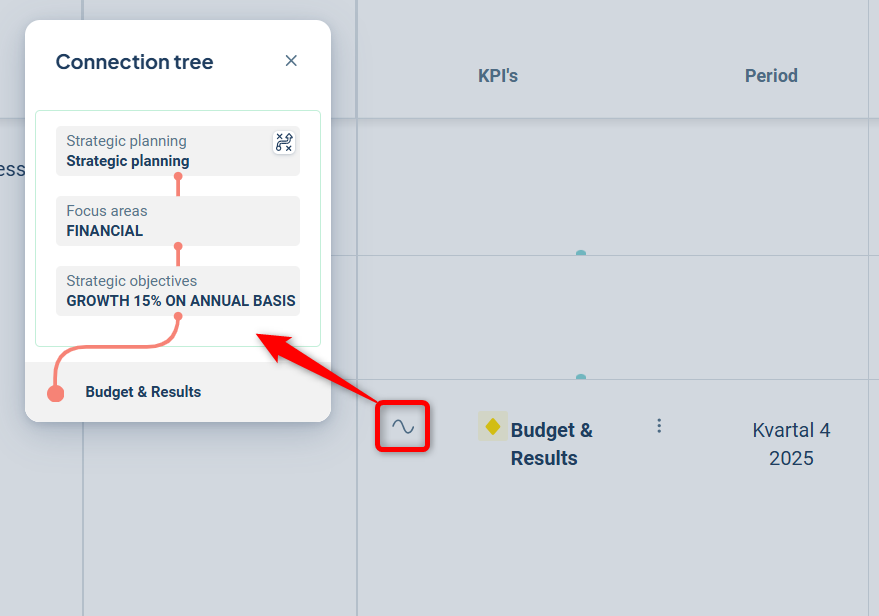
In the new view type, you can display node properties by selecting "Thread mode" to visualize how an object is connected.
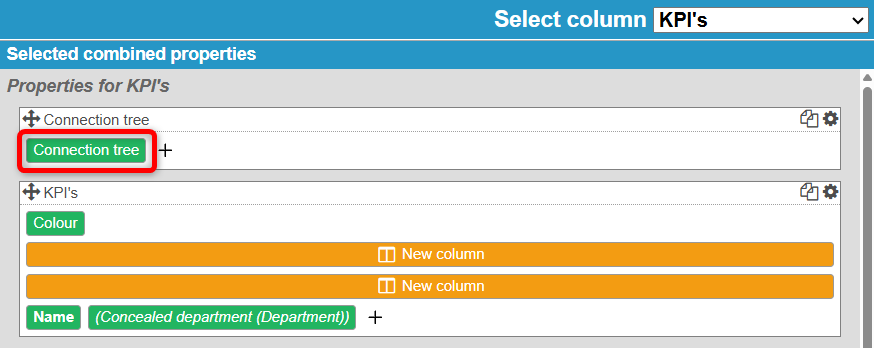
The node property is displayed as a sine wave icon, and when the user clicks on it, the connections are shown clearly on the left-hand side for easy overview.
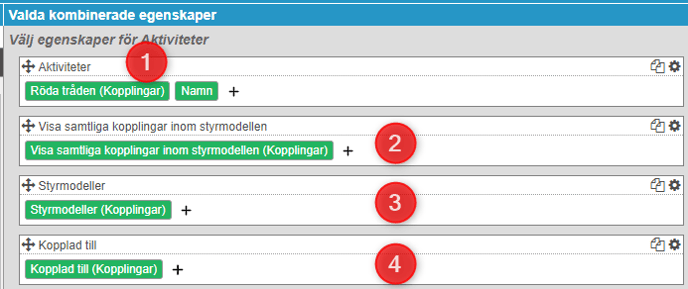
In the classic views and the consolidation view, there are several other node properties that can be used to display connections in views and report sections. Below is an example from a view:
1) The red thread displays the entire connection chain when you hover over the icon with your cursor.
2) You can view all connections within the scorecard, including which scorecard the connection belongs to 3), and which node(s) this node is connected to 4).

Hidden Nodes and Connections
This section applies only to organizations using the Hidden Nodes feature.
When you create a new object that is connected to a hidden node, the new object will by default also become a hidden node.
However, you can choose whether the object should be hidden or not at the time of creation—please note that this can only be managed in the classic edit window.

If you add a connection from an existing object to a hidden node, the connected node will not automatically become hidden.
Advanced Settings
In the administration panel for scorecard columns, there is a setting called:
"Allow editing of connections for measures/activities in consolidation chains".

When this setting is enabled, it becomes possible to add and remove connections at lower levels within a distributed node. This is not a recommended setting by default—please contact Stratsys before enabling it to discuss the potential advantages and disadvantages.