Display the results from checklists and the linked risks and actions in views and reports.
Visualization of Forms in Views and Reports
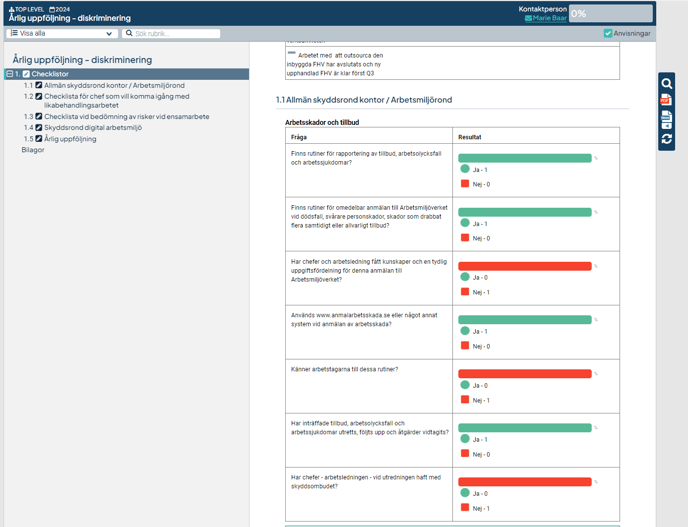
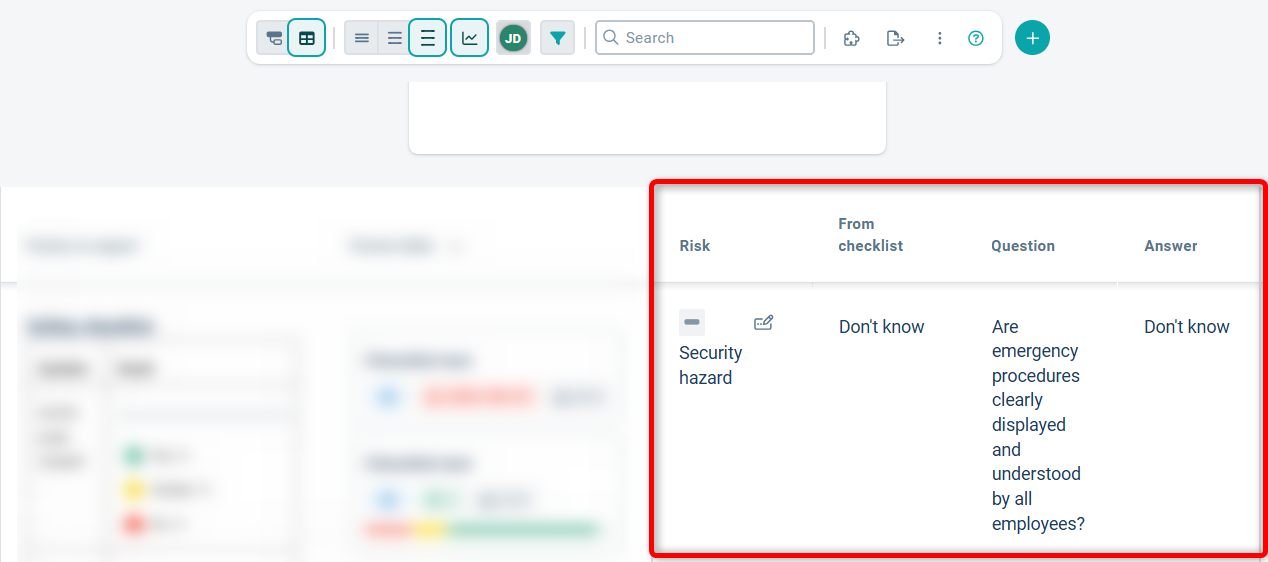
Checklist Results in Views
The results of all questions in a checklist are automatically displayed in views. No configuration is required to access the results in the view from the checklist card.
Linked Risks and Actions in Views and Reports
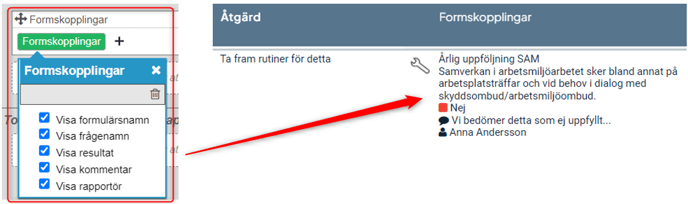
In both views and report sections, it is possible to visualize that the actions and risks created in response to checklist questions originate from a checklist.
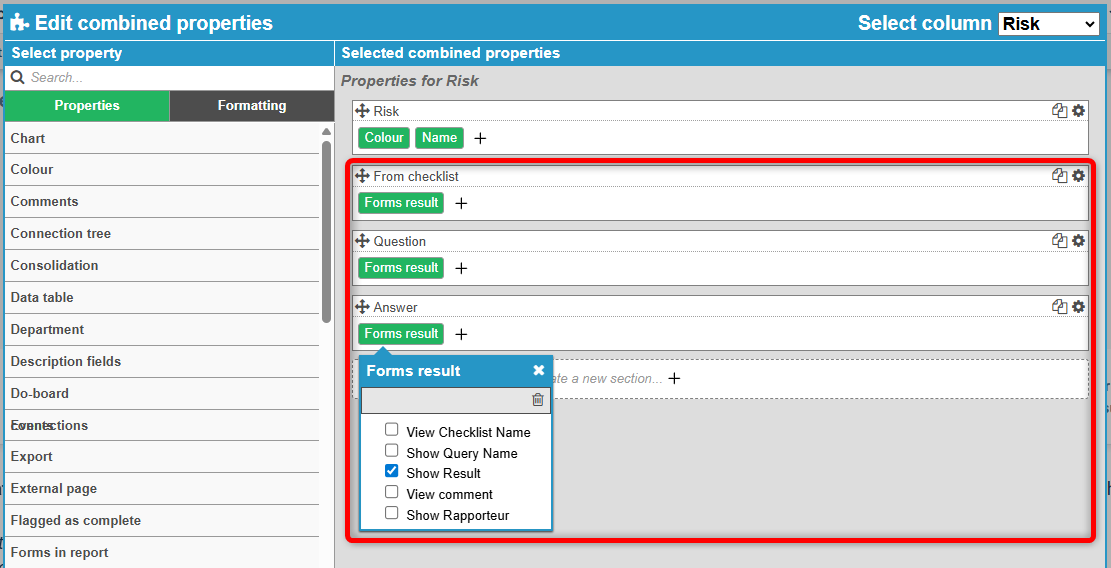
To display this relationship, use the node property Forms Result. The section heading for node properties can be customized – read more in Change the Heading for a Section.
The properties in the Forms connection can display:
-
The name of the checklist from which the action or risk was created
-
The name of the question from which the action or risk was created
-
The result for the specific question from which the action or risk was created
-
Any comment from the specific question from which the action or risk was created
-
The reporting user for the question from which the action or risk was created
The example below shows all properties for Forms results:
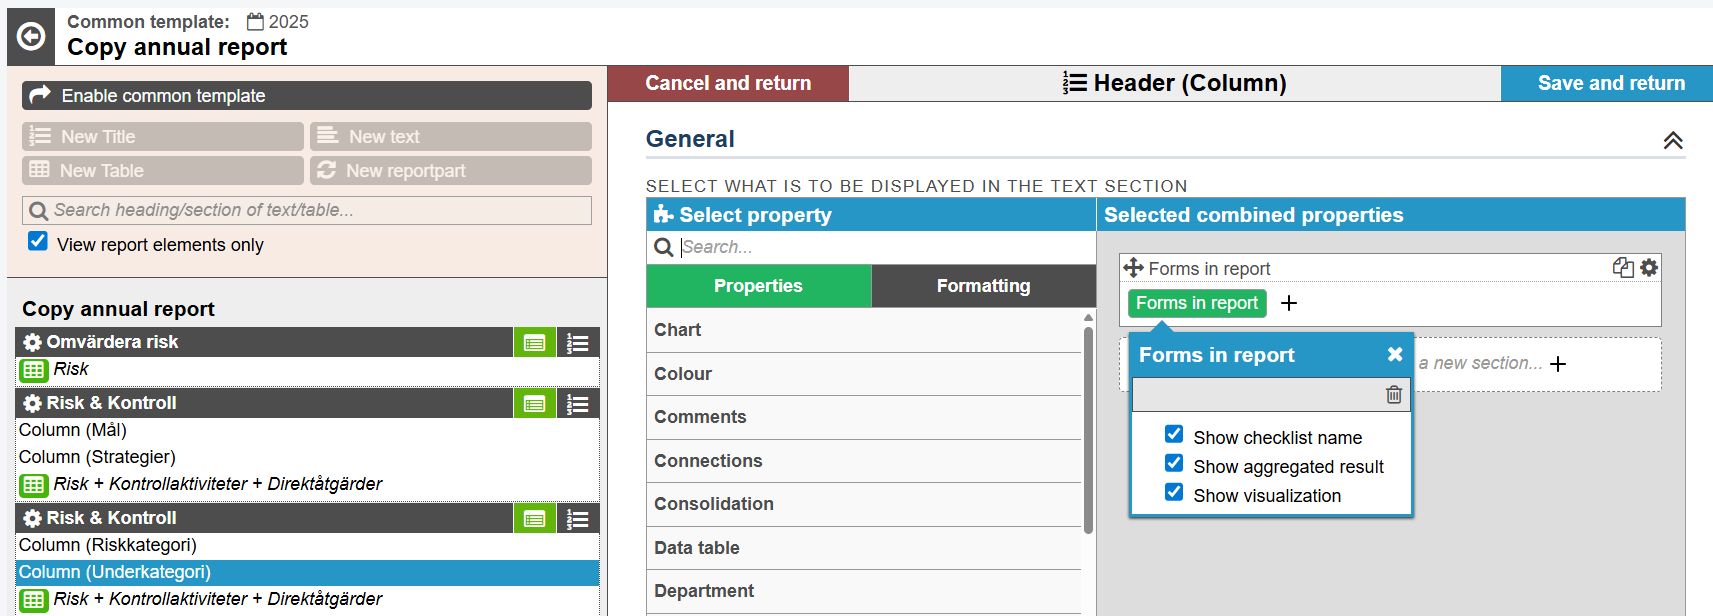
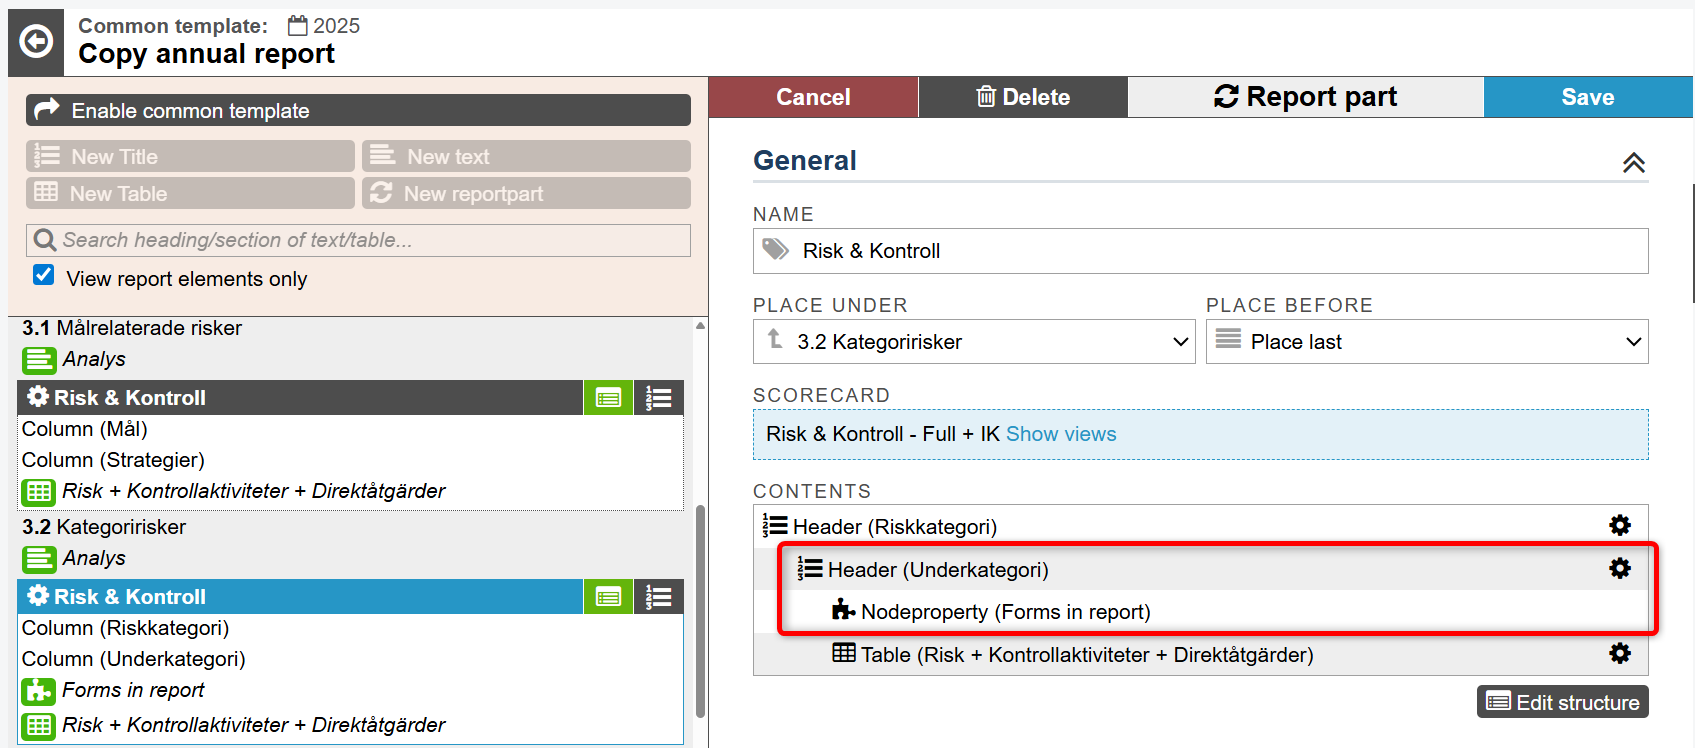
For reports, there is a dedicated node property, Forms in Report, which you can use in report sections.
Limitations:
-
Only results from checklists where the deadline has passed will be included in the report.
-
The function does not support extra occasions (when a unit responds outside a planned occasion), only planned ones.
-
Responses from Multiple Choice and Free Text questions are currently not supported for display in reports.
You use the node property in the linked object, and you can display the checklist name, aggregated results, and a visualization of questions and answers.
The aggregated result summarizes the outcome for the current unit and its underlying units.