There are three methods for reporting measures, Reporting in the tab of the Report in Report window And Reporting directly in the view.


Reporting in the Reporting window
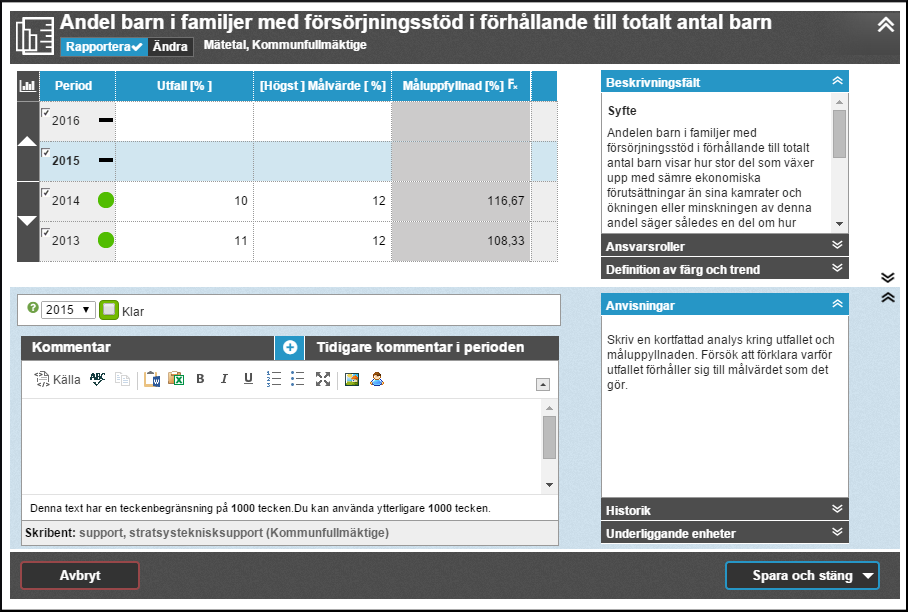
The window consists of two parts. The upper part is report the part and the lower is commenting the part.

- At the top left there are two hot keys that allow you to switch between report and Comment window with Change window.
- With the arrow up in the right corner of the window you can minimize the entire report and Comment window to see the information behind the window.
- There are two smaller maximize minimize arrows in the middle on the right side. With these you can maximize and minimize the report window and Kommenterafönstret.
Comment in the comment fields
When you write a comment, you enter the reporting mode of the current node. You start by making sure that the correct period is selected in the period selector, and then type your comment in the comment field below.
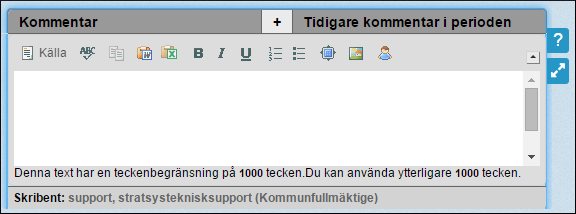
The functions found in the toolbar (see figure below) should support you when reporting in the comment.
- Spelling of the text you entered
- Select text and copy
- Paste copied text
- Paste from Excel (see chapter below for more information)
- Made text
- Italic text
- Underscored text
- Number list
- Bullet list
- Magnification of the area of the
- Ability to paste image. If you use this button, an additional dialog box opens
The toolbar features are explained below.
Paste table or text
Note that you can never paste tables and pieces of text at the same time. If you paste a large section that contains both text and tables, the tables will be cleared and the text only pasted if you selected Paste from Word. The reversed ratio applies if you selected Paste table from Excel.
Tables can be pasted from both Excel and Word. To do this, use the Word  and Excelikonerna
  On the Text Field toolbar.
Obs! When you paste, graphical formatting is cleared. That is, background colors, text colors, placements, indents, borders, and pictures inside a table. However, cell formatting (such as currency, percentage, date, and so on) remains. The same applies to merged cells in a horizontal direction.
If it is a table you pasted, you will be directly to a dialog box where you can change the appearance and format of the table. If it is a text, format it directly in the story.
Paste table from Excel
Select the table in Excel and copy it with, for example, CTRL + C.
Return to the text field of the report, set the cursor where you want to place the new table, and click the button Paste Table.

Now, a box called "Paste Table" opens. Paste the table in the box by pressing "Ctrl + V" or right-click and then click Paste. Then click on the button OK At the bottom left.
Obs! It is important that the Paste instructions is up while you select in the Excel table and then paste, otherwise the paste will not work.

Keep in mind that the table will fit when the report is later exported to Word or PDF. If the table is wider than an A4 (excluding margins), it will most likely be too wide for export to Word or PDF and therefore not look good when exporting.
To preview in Excel, do this for example. By selecting the display mode Page layout in Statusfield. When you are finished previewing, return to the display mode Normal That appears to the left of Page layout.

Change the width of columns in pasted tables
After pasting a table into the Stratsys, you can change the column width of the table later.
Note that you must have used the button Paste Table For this to work.
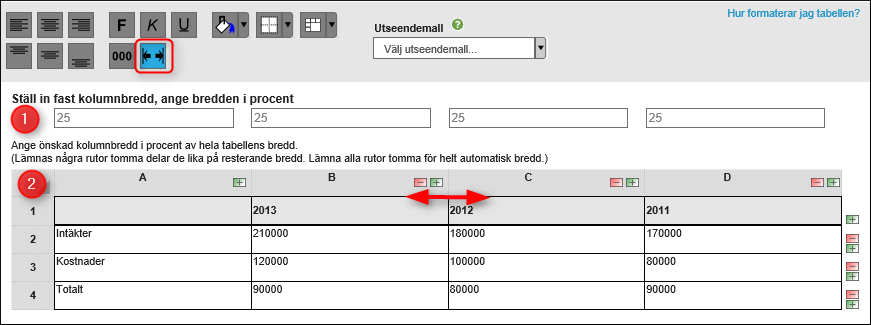
To change the column width, first double-click the symbol to edit the table (the wrench)
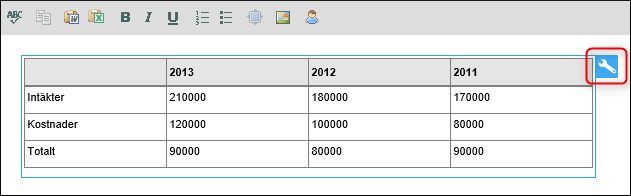
A new window opens and here you can change the column width in two different ways:
1. Click on the box Almost Column width and set the desired width for the different columns in%.
2. Click on the box Fast Column width and Ccick on the edge of the columns to drag the columns to the size you want on them.
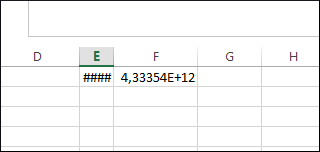
Error messages from Excel
Be sure to check your data in Excel before copying. For example, if the columns are are too narrow to accommodate a value (shown as # # # # # # #), the correct value is not included when copying. The simplest way to fix this is by selecting all of the current columns in Excel and then double-clicking between two column headings (for example, D and E). Select and then copy as usual before pasting.
Paste Text
You can by using the Word icon on the Report window toolbar  You can also use Crtl + V.
You can also use Crtl + V.formatting when pasting:
When you paste, graphical formatting is cleared. That is, background colors, text colors, placements, indents, borders, and pictures inside a table. However, cell formatting (such as currency, percentage, date, and so on) remains. The same applies to merged cells in a horizontal direction.
If it is a table you pasted, you will be directly to a dialog box where you can change the appearance and format of the table. If it is a text, format it directly in the story.
Edit pasted table
Double-click the table to enter edit mode.
You have the option to add or remove rows even in pasted tables.
Make bulleted or numbered lists
When a bulleted or numbered list is pasted from another document, the formatting of the bullets/numbering will disappear. Therefore, it is best to make bulleted and numbered lists in the comments pane. Select the selected lines and click on the icon for the desired list.![]()
Fullscreen view
When a lot of text is inserted and formatted, the regular comment box can provide a limited overview. To enlarge the page, you can use the Fullscreen view function. You enable it if you click this icon. You need to exit full-screen mode before saving and closing the node. To exit the full-screen mode, click the same icon again.![]()
Insert Picture
You can choose whether to insert an image file or to paste something you've copied, such as an Office program as an image. This is used ex... Excel tables with advanced formatting. Cannot edit further in Stratsys. Keep in mind that the size should fit in the Word template!
Java problem when pasting from clipboard
If the first time you use this feature, you'll get a security warning: "The digital signature of the application has been verified. Do you want to run the program? " Select Run Or OK. Now start a so-called "Java apple" and after a few seconds the button appears Paste.
If you encounter problems when you paste images, it may be because you need to update Java to a newer version on the current computer.
Move image
Drag and drop the image where you want it to appear. Excel tables pasted from the Clipboard are also saved as an image.
Delete image
Click on the image and then press the "Delete" key.
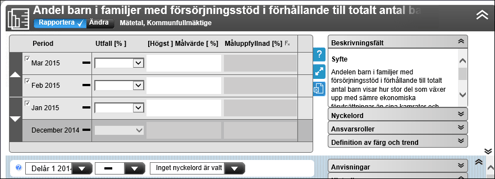
Report data in the Measure reporting field
Measure
- The Description field displays informational text such as Purpose, method and target value
- The responsibility role shows who is responsible for KPI
- Color and Trend Definition displays information from the Standard KPI used.
- For measures, there is the tab, which reports the outcome for the different periods. The columns may look different depending on the Standard KPI that is selected for the measure.
Report on activities Reporting field
For activities, the report and Comment window looks a little different when it comes to managing the status. Here you can change the status of the activity, end date, implementation panel. What the appearance looks like depends a little on the settings that are turned on by the administrator.

Reporting in the view
If your local administrator has enabled the report to be allowed directly in the view, you can see this by having a report button on the toolbar in the upper-right corner of the view.  To report, click on the button Report, then fill in your values directly in the view and finally click on the button Save In the top left.
You also have the option to paste copied values directly from eg. Excel If the data is presented in exactly the same way in the source. See the help text.
Obs! Before you start filling in your values, make sure you fill in for the correct period.
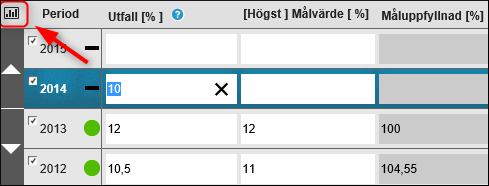
You can also use the Inline editing If this is enabled for the view. Then you only need to set yourself in the column where you want to edit/change/Enter the desired data and click to do this. When you are finished, select to click Check mark To save or Crossing To remove. Here you can also klarmarkera the comment.

Obs! box to Check mark a comment on Inline edit Does not appear if "Make selecting color Mandatory" is enabled in Comment Settings/tab: Advanced.


View charts directly in the Report window for measures
To simplify the reporting of measurements, you can display charts instead of looking at the numbers in tabular form directly from the Report window. In order to allow for a good analysis, it is often easier to see the data in chart form compared to the tabular format.
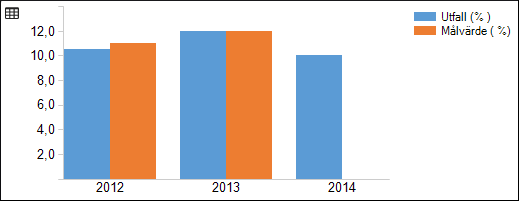
To display the figures in tabular form for a measure, first click the Rapporterafönstret for the measure. In the Report window, click Display chart at the top of the left corner.
The figures are displayed in graph form.
Obs. To see all the numbers from the table in the chart, click the Click to expand the box FTo expand the table. From here you can then click on the Display chart to get the figures in chart form.
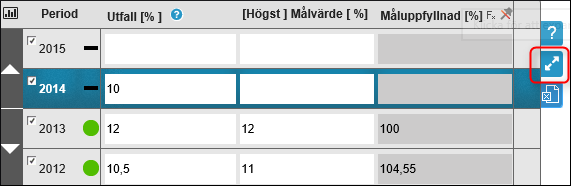
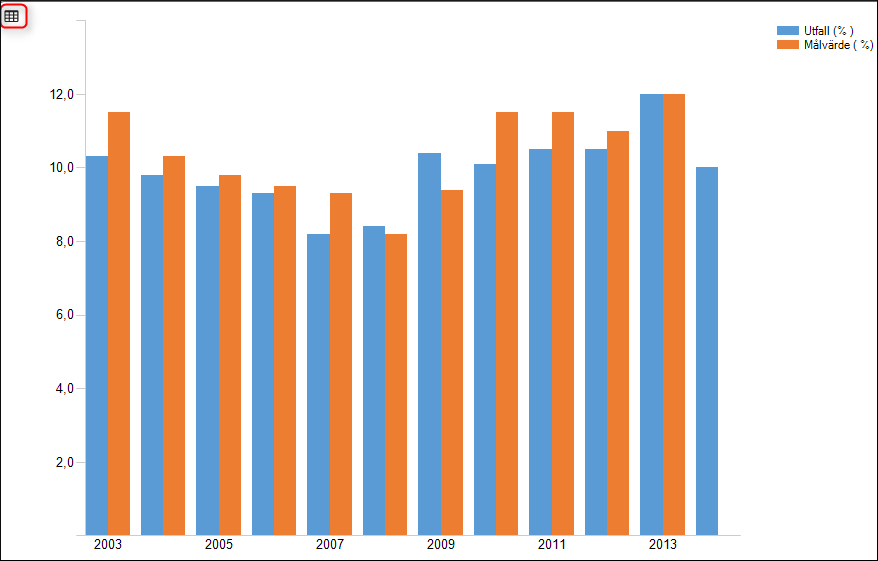
You can also double-click directly on the table to get an even more comprahensive image.
Alternatively, you can click Expand the Report section of the dialog to display a larger portion of the table and chart in the existing window.
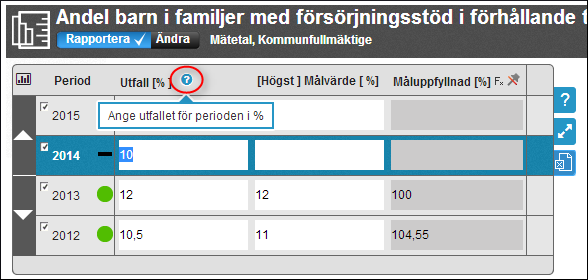
Instructions for reporting KPI data
Instructions can be added for the data columns in measurements. These instructions are visible in the context of reporting and aim to describe what is to be reported in the column.
To add an instruction to a measure column, first click the Open Report window for the measure column.
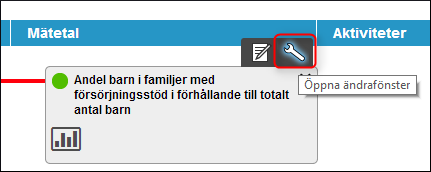
Then click Change In the quick settings. Then, switch the tab to Settings.
Then click on the column you want to write an instruction for. In the text box for Description You can then enter the instruction you want for the column.
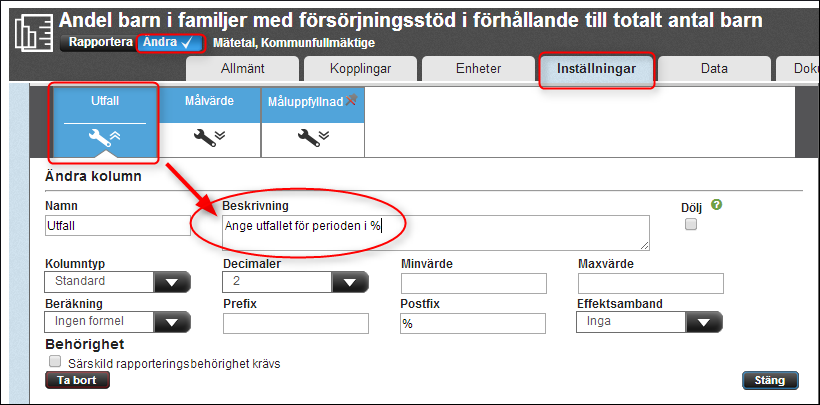
You can then see the instructions in the rapporteraläget if you hover your mouse over the blue question mark.