Analyze and use the results as a basis for follow-up and in reports.
View Results in the Checklist Card
Detailed Results via the Checklist
View Results in the Follow-up Window
View Results via the Checklist Gadget
View Results in the Checklist Card
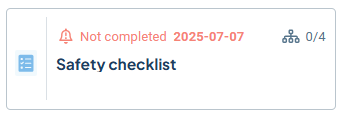
The checklist card displays the status, the name of the checklist, and information about the number of responses in relation to the number of reporting units.
You see a summary of the responses in percentages of red, yellow, and green answers. The card shows the status on the top row—here are some examples of these. More information appears when you hover your cursor over the bars.
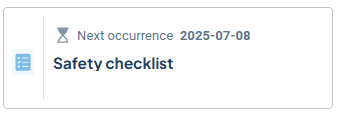
- Reporting has not yet opened because the start date is in the future: Hourglass icon, text “Next occurrence” and the start date.
-
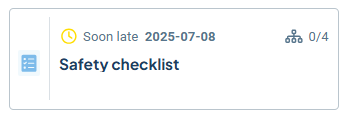
Checklist is approaching deadline: Yellow clock icon, text “Soon late” and the deadline.
-
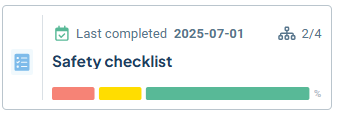
The checklist has been completed by the person responsible for the unit in question: Green checkbox icon, text “Last completed” and the date the response was submitted.
-
The checklist has a deadline today or the deadline has already passed: Red clock icon, text “Not completed” and the deadline.
Detailed Results via the Checklist
You can open the checklist card from your to-do card, from a checklist card in a view, or from a checklist gadget. The example below shows access from a view.
-
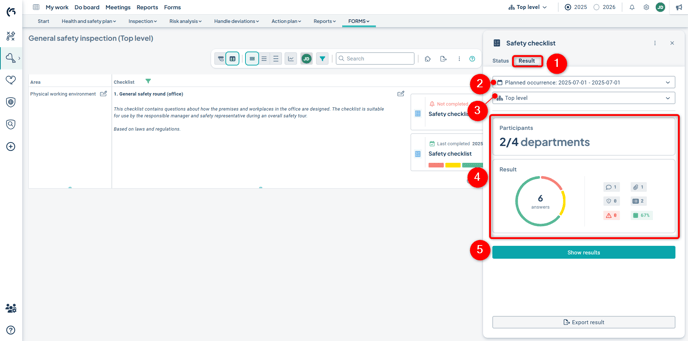
Select the “Results” tab on the card to the right.
-
Choose which response round you want to view results from in the top dropdown, if multiple rounds have been completed. The default is the most recent. The “planned occurrence” show results from all units that received the checklist. If there are responses reported outside of the planned occurences, this is indicated with a date. In that case, responses are shown only from the relevant unit.
-
Select which units you want to view results from in the next dropdown; the results will include those from underlying units.
-
You will see a preview showing who has responded to the selected round once your selections are made.
-
Click “Show Results” when satisfied with your selection.
You can also export the results to PDF format via the button at the bottom right of this view.
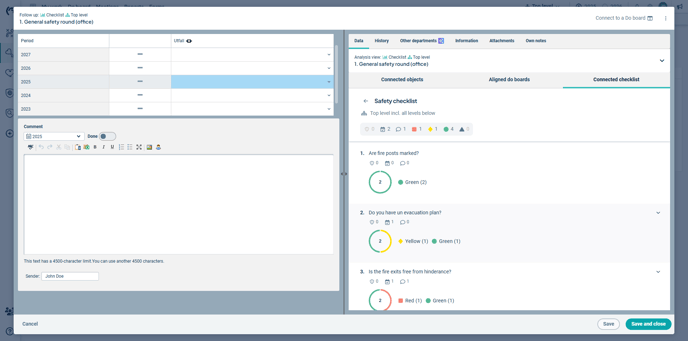
A larger results view will open. Here you can see:
-
A toolbar at the top where you can choose what to view at the moment
-
A summary for the selected unit level, including underlying units, with filter buttons
-
Results for units one level below the selected unit
Return to the view by clicking the arrow in the top left corner.
 Toolbar
Using the toolbar, you can switch display mode via the three buttons on the left. Choose between:
-
Summary of one level below (microscope icon)
-
List of questions for the selected unit (list icon)
-
Sample result (test tube icon – only available for sample checklists)
In the dropdowns, you select which occasion you want to view and which unit you want to focus on at the moment.
![]()
Summary of One Level Below
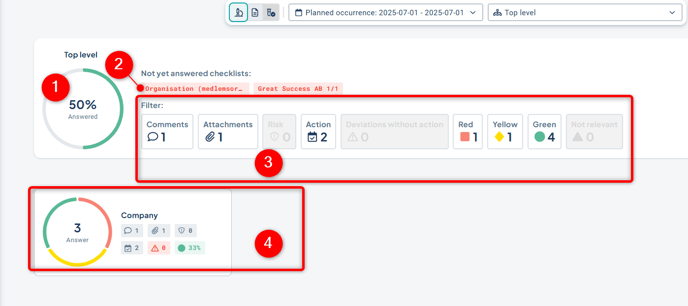
In the "Summary of One Level Below" display mode, you will see:
1) Progress showing how many responses have been submitted for the entire checklist — for example, 8%.
2) Which units have not yet responded. This is summarized at the nearest underlying unit level. For instance, 1/3 means that one out of three units has not responded on that unit or its sub-units.
3) Filters – when you click on a filter option, the section below will display which nearest underlying units match the selected filter.
4) The filtered results are shown in the section below.
Lista på frågorna för vald enhet
Listvyläget visar resultatet för frågorna på vald enhet i rullistan längst upp till höger och dess underliggande enheter. Filtrena påverkar här vilka frågor som visas. I exemplet är "Åtgärd" vald, varpå de två frågorna som har fått åtgärder visas i listan.
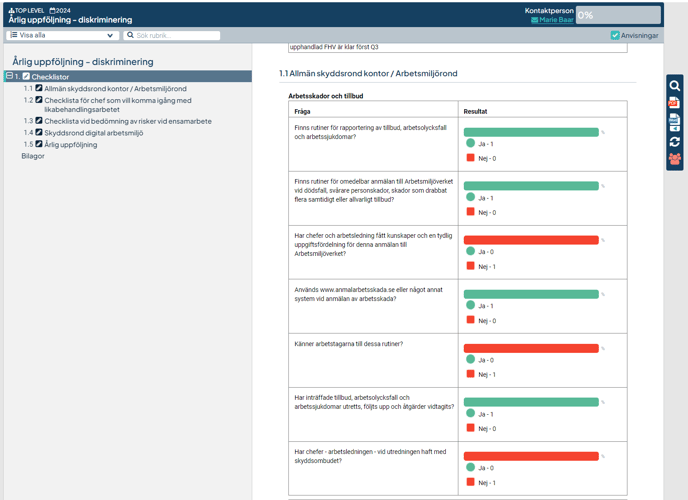
List of Questions for Selected Department
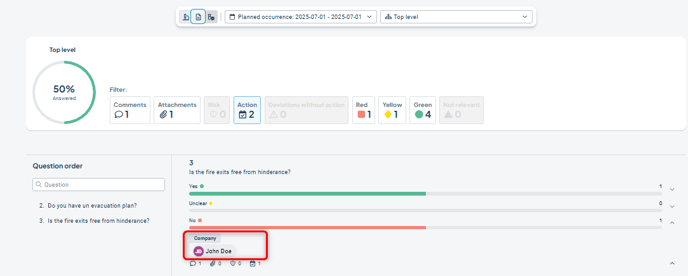
The list view displays the results for the questions at the unit selected in the dropdown at the top right, along with its underlying units. The filters determine which questions are shown. In the example, “Action” is selected, so the two questions that have actions linked to them are shown in the list.
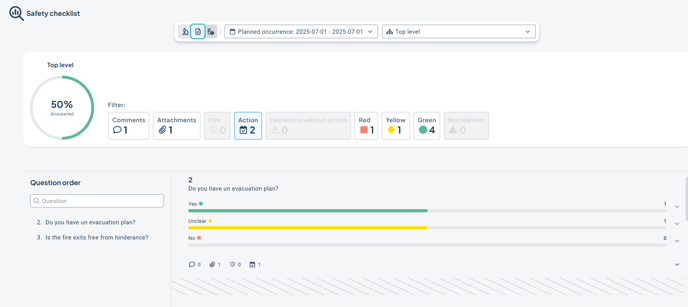
On the far right, you can see how many have responded Yes / Partly / No to each question. By expanding with the upper arrow (1), you can see which units submitted that response.
By expanding with the lower arrow (2), you can view actions, risks, comments, and attachments. You can also add actions and risks to the question here if you believe any are missing.
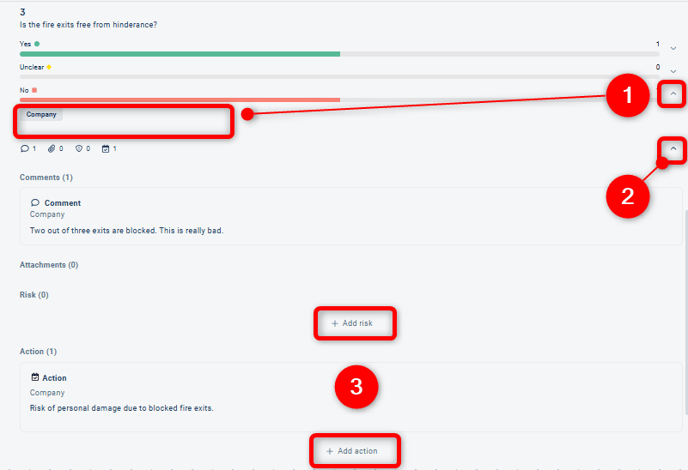
View Who Responded:
By clicking on the unit that submitted the checklist, the person who answered the question will be displayed. The user who submitted the checklist is not shown.
Actions and Risks Created from a Checklist
Actions and risks created through the checklist are placed in the respective management model column at the reporting unit, linked to the same node as the checklist itself. If both a risk and an action are created for the same question, they will be linked together. Read about how administrators can configure the display of actions and risks: Configure Visualization of Forms Checklists.
 These may sometimes have mandatory fields that need to be completed, such as end dates for activities or required description fields or keyword groups. Open the risk/action and complete the information if necessary.
In classic views, this is indicated by a greyed-out wrench icon with a chart symbol. Click the wrench and fill in the required details, then save.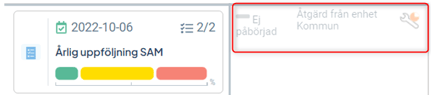
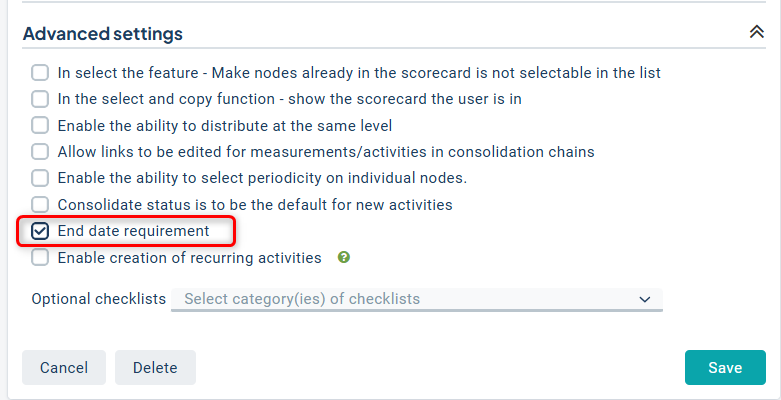
Tip for Administrators: For actions, it is possible to disable the requirement for an end date in the advanced settings of the scorecard column if desired.
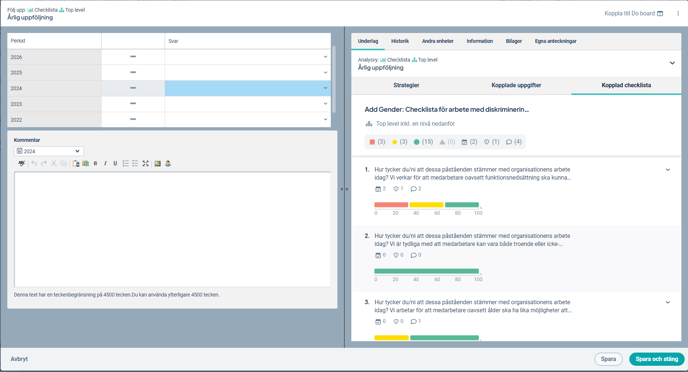
View Results in the Follow-up Window
When a checklist is linked to an object, you will also be able to view the checklist results from the follow-up window. The results are collected under the “Linked Checklist” tab, providing a consolidated basis that facilitates the final assessment.
View Results in Reports
It is possible to present the results in reports. This is configured by the report administrator. An example is shown below. Please note that responses from Multiple Choice and Free Text questions are currently not supported for display in reports.
Learn more about how administrators can configure this: Configure Visualization of Forms Checklists.
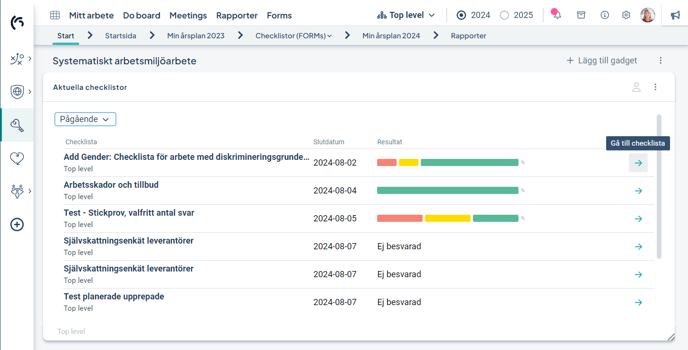
View Results via the Checklist Gadget
You can add a gadget to your start page (My Work) that displays current checklists. An administrator can add the gadget to the product's start page.
From the gadget, you can open the checklist by clicking the “Go to checklist” arrow to access the results.
Learn more: Gadget for Current Checklists