View and Gadget for GHG Protocol
It is possible to display a gadget in the view for the sustainability product to support the overview in the GHG view. The purpose of the overview is to enhance both analysis and the current state assessment of emissions by presenting emissions data in relation to baseline and target values.
Functionality
-
Ability to compare total emissions data with baseline and target year values in the GHG Protocol view.
-
Ability to toggle between location-based and market-based emissions.
-
Ability to receive an indication of progress toward emission targets.
-
Ability to filter emissions data by scope.
-
Ability to automatically populate future periods for the baseline year based on emissions data.
Permission Requirements
-
Product license for Sustainability Management.
-
To activate the feature, contact your Stratsys representative.
Setup
To add the gadget, the following must be configured:
-
The view for the scorecard must contain a scorecard column set as “Emission Calculation”.
-
A correctly configured measure template (measure data columns for emission actuals, target, and baseline, using the baseline value formula — see more here) that is visible for the scorecard column “Total Emissions”. We recommend contacting Stratsys for support to ensure the setup is correct.
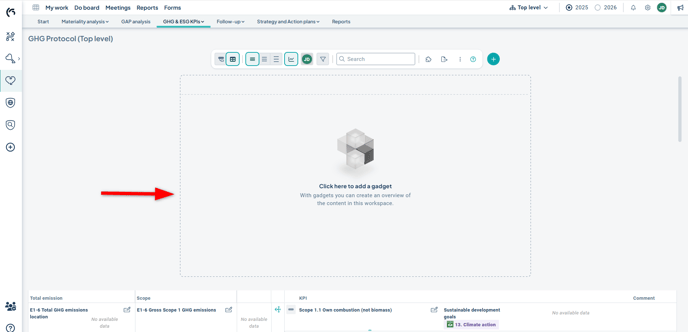
To add the gadget to a view that meets the permission requirements, a gadget placeholder will be displayed. Clicking the placeholder opens a new window where you can configure the gadget.
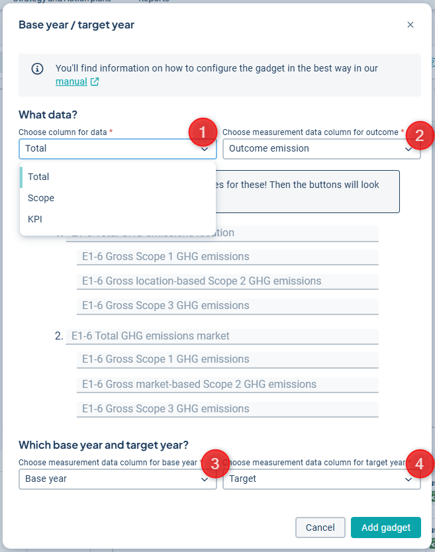
In the configuration window, as a global administrator or scorecard administrator, you select:
-
Which scorecard column’s data to display in the gadget (Total Emissions)
-
The measure data column for results (Emission Actuals)
-
The measure data column for the baseline year
-
The measure data column for the target year
Tip!
Consider giving the tabs in the gadget shorter names to improve readability and clarify the buttons in the gadget. In the image below, the gadget interface is shown on the right, where you can edit the tab names inline.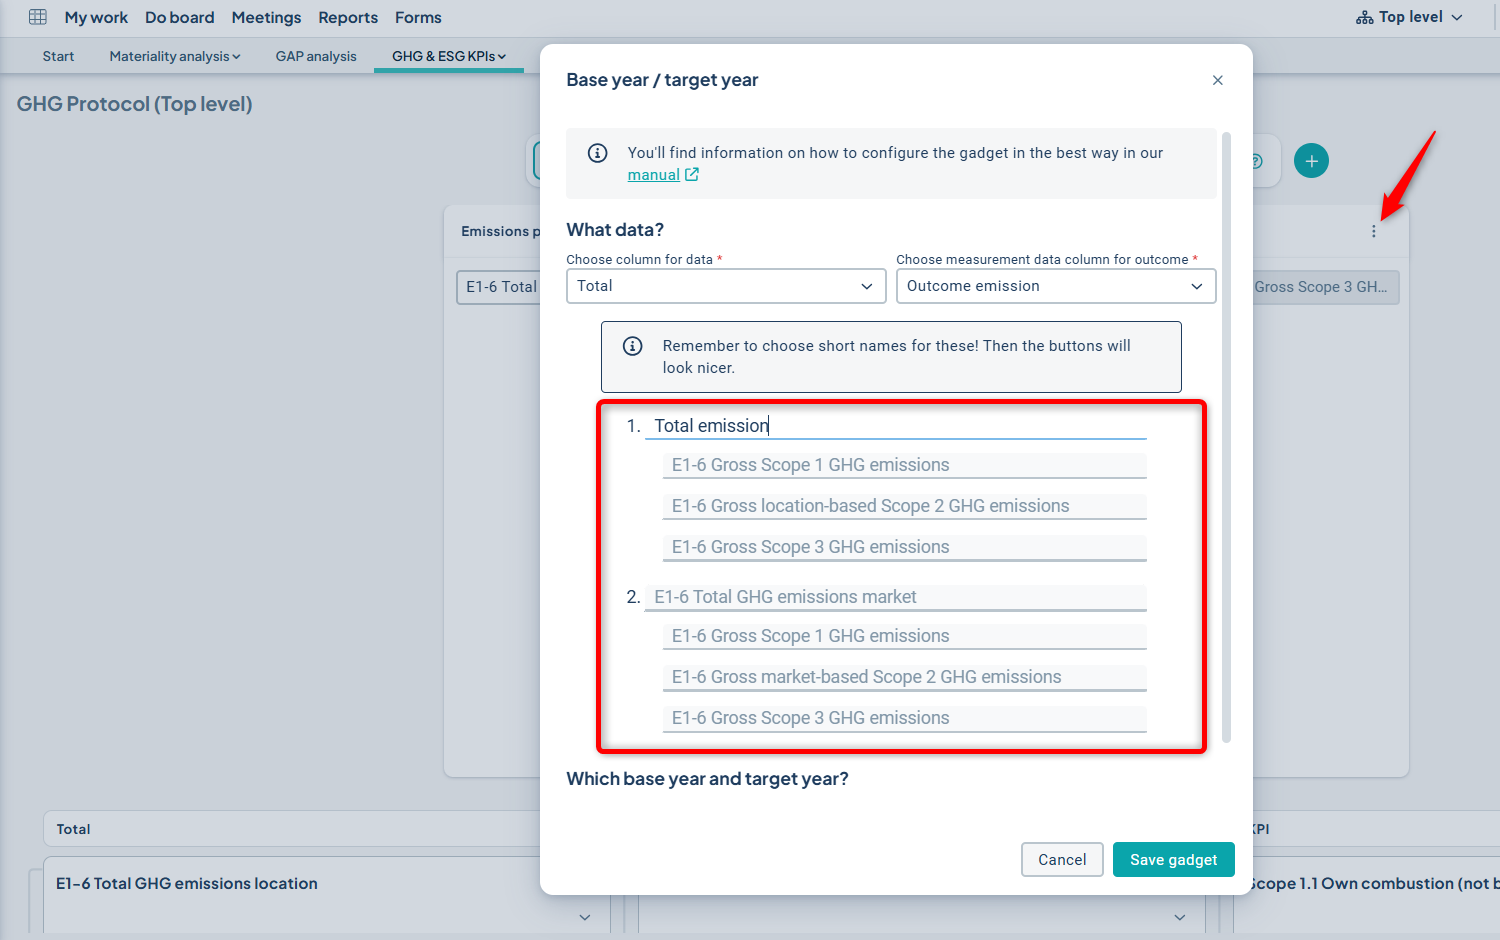
Visualization
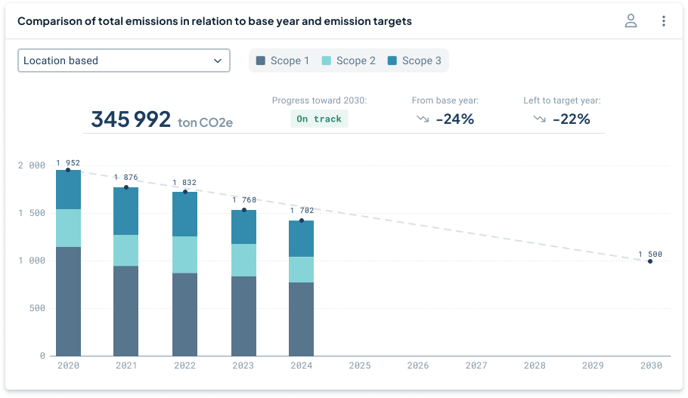
This section explains what is displayed in the chart, as shown in the image below:
1. Shows the current total emissions depending on the selection in the dropdown (location-based). Data including decimals and unit (tons CO₂e) is retrieved from the object “Total Emissions” (location-based in the example below).
2. Shows the current total deviation from the baseline year in percent. The percentage is always calculated based on the 'latest period' for actuals. Data is retrieved from the object “location-based” in the example below.
3. Shows the current total deviation from the target year in percent.
4. If you have emissions data for at least one period (e.g., 2020), it also displays whether you are on track or deviating from the target, showing this in relation to the nearest target value.
-png.png?width=688&height=398&name=Group%208466%20(1)-png.png)
Example (not based on the image above)
Baseline year (period, value) = 2020, 1952
Target year (period, value) = 2030, 1500
Each period represents the desired change:
= -1 × (1952 – 1500) / 10 (since there are 10 periods in between)
= -45.2 per period
Therefore, the expected target value for 2026 would be 1680.8.
If the current period is 2026 and:
a. the actual value is above the expected value, “Off Track” is displayed.
b. the actual value is below the expected value, “On Track” is displayed.
5. The entered values for the baseline year and target year are used to display a progress line toward the goal in the chart. This line is automatically shown if data is available for both the baseline and target years.
Important Considerations!
The chart will only be able to aggregate data from objects that have identical measure columns and names for those columns.
It is therefore crucial that all objects in the view, located in the columns “Total Emissions” and “Scope,” have identical names for the measure data columns used to aggregate data in the gadget:
(1) Emission Actuals (2) Baseline Year (3) Target Year, where:
-
The Emission Actuals column must use the actual column type
-
The Baseline column must use the baseline year formula
-
The Target column must use the “target” column type (not “target year”)
The measure data columns do not need to have the exact same names as in the example above — the key is that they are consistently named in your configuration. Contact your Stratsys representative to ensure that your measure templates are set up correctly!
Important!
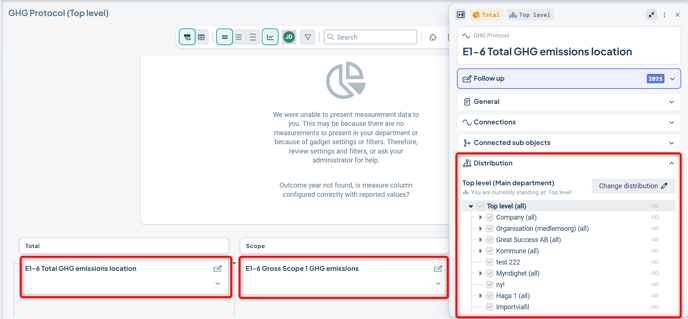
No data will be displayed in the chart if the baseline and target year values are missing. In such cases, only a message will appear in the gadget indicating that data cannot be displayed — regardless of whether emissions data exists.
To ensure that the visualization works for other units/departments beyond the one where the gadget and measures in the view were created, the objects (e.g., Total Emissions – Location-Based and Market-Based) must be distributed down in the organization.