The terminology of the Stratsys for how information in a view is to be visualized is referred to in the tool as view modes. But in daily numbers is used as often or more often the word type but reference to whether the view displays information such as Gantschema, table, Drag and drop, and more, which is the selected display mode for the view. Hence, the title contains the word view types with display mode in parentheses.
There are different appearances of views, below are three columns up in different view styles. They are often used for different purposes, drag-and-drop is most common in the planning phase when it is easy to see connections, however, it takes a lot of space in the view, and therefore a different type of view is recommended for follow-up.
The terminology of the Stratsys for how information in a view is to be visualized is referred to in the tool as view modes. But in daily numbers is used as often or more often the word type but reference to whether the view displays information such as Gantschema, table, Drag and drop, and more, which is the selected display mode for the view. Hence, the title contains the word view types with display mode in parentheses.
View types
Träd - Drag and Drop

Table-Tree structure

Table

Standing

Controlroom

Gantt-Scheme
A ganttschema is a graphical representation of the activities planned during the current year. The tasks are displayed horizontally, showing each task's implementation time, start and finish dates, and status.
Obs! Ganttscheme cannot be selected as type. A ganttschema is generated from Views of Scorecards. When the view is created, it can be edited in the same way as regular views. That is, either by clicking Wrench  At the view in Views of Scorecards or by clicking
  Gear wheel That appears to the right when you are inside the view.
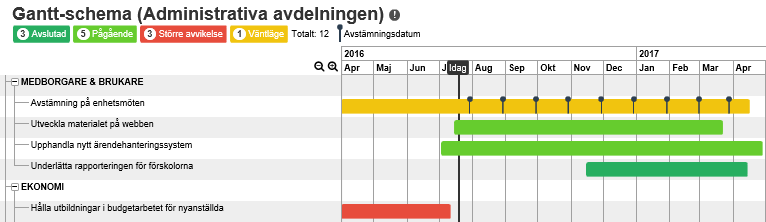
Accessibility in view
You can find the temporary filter on the toolbar. The toolbar is located at the far right of each view and is included as you scroll down the page. The change and Report window icons appear when you hover over a node.

